Data & Analysis
Every forecast the agent makes is published here in full: the scan, the reasoning trace behind it, and the price follow-ups that show how the market moved afterward. The dataset is available for non-commercial research; contact the authors for bulk access. The charts below are regenerated from the live database, so they shift as scans accumulate.
Pull the data
The full source code, including the pipeline, analysis scripts, and figure generators, lives on GitHub:
github.com/wyw2010/forecasting-agent →
All data endpoints return JSON. The primary endpoint is a single-shot dump of every scan, trace, trade, price follow-up, and P&L snapshot:
curl -H "Authorization: Bearer ACCESS_PASSWORD" https://forecast.agenticlearning.ai/api/export > export.jsonOr export straight from the browser — enter the access password and download the full JSON dump:
| endpoint | what it returns |
|---|---|
/api/export |
Full JSON dump: scans, V2 reasoning traces, trades, price follow-ups, P&L snapshots, summary.
Archived scans are excluded by default; pass
?include_archived=true to include them.
access password
|
/api/metaculus/export |
Full JSON dump of the Metaculus tournament-bot traces (separate from the Kalshi
scanner data above): each question's submitted forecast plus the full reasoning trace.
Use post_id / question_id to look up resolutions via the Metaculus API.
Pass ?include_trace=false for a metadata-only dump.
access password
|
/api/traces |
Paginated index of full reasoning traces from both forecasters
(?source=scanner|metaculus), with per-trace detail at
/api/traces/{source}/{id}. The streamlined way to pull traces without
downloading the full export — see the API docs.
token · traces:read
|
/api/decisions |
Trade-decision ledger for external consumers: one capital-independent signal per
decision. Live push companion at /api/decisions/stream (Server-Sent
Events) — see the API docs.
token · decisions:read
|
/api/scans |
Most recent 200 scans with market, prediction, edge, and confidence. access password |
/api/trades |
Paper-trade log. Optional ?status=open|closed|all. access password |
/api/pnl |
Current P&L summary (totals, win rate, deployed capital). |
/api/pnl-series |
Full P&L time series with per-minute timestamps. |
/api/followups |
Price follow-ups at t+1…t+30 days for every scan. access password |
/api/trade/{id}/market-data |
Historical price series for one trade's market. |
To reproduce the analysis in the paper:
git clone https://github.com/wyw2010/forecasting-agent && cd forecasting-agentcurl -H "Authorization: Bearer ACCESS_PASSWORD" https://forecast.agenticlearning.ai/api/export > data/export_latest.jsonpulls the latest export (request the access password from the authors).python analysis/extract_factors.py --input data/export_latest.json --output analysis/output/factors.csvextracts per-scan factors from the reasoning traces.python analysis/compute_directional_accuracy.py --factors analysis/output/factors.csv --data data/export_latest.json --output analysis/output/factors_with_da.csvjoins the factors with price follow-ups.python analysis/generate_figures.py --out-dir out/ --min-date 2026-04-07 --data data/export_latest.jsonproduces the headline charts below.python analysis/generate_ablation_figures.py --out-dir out/ --min-date 2026-04-07 --horizon 3produces the pipeline and tool ablations.
Headline charts
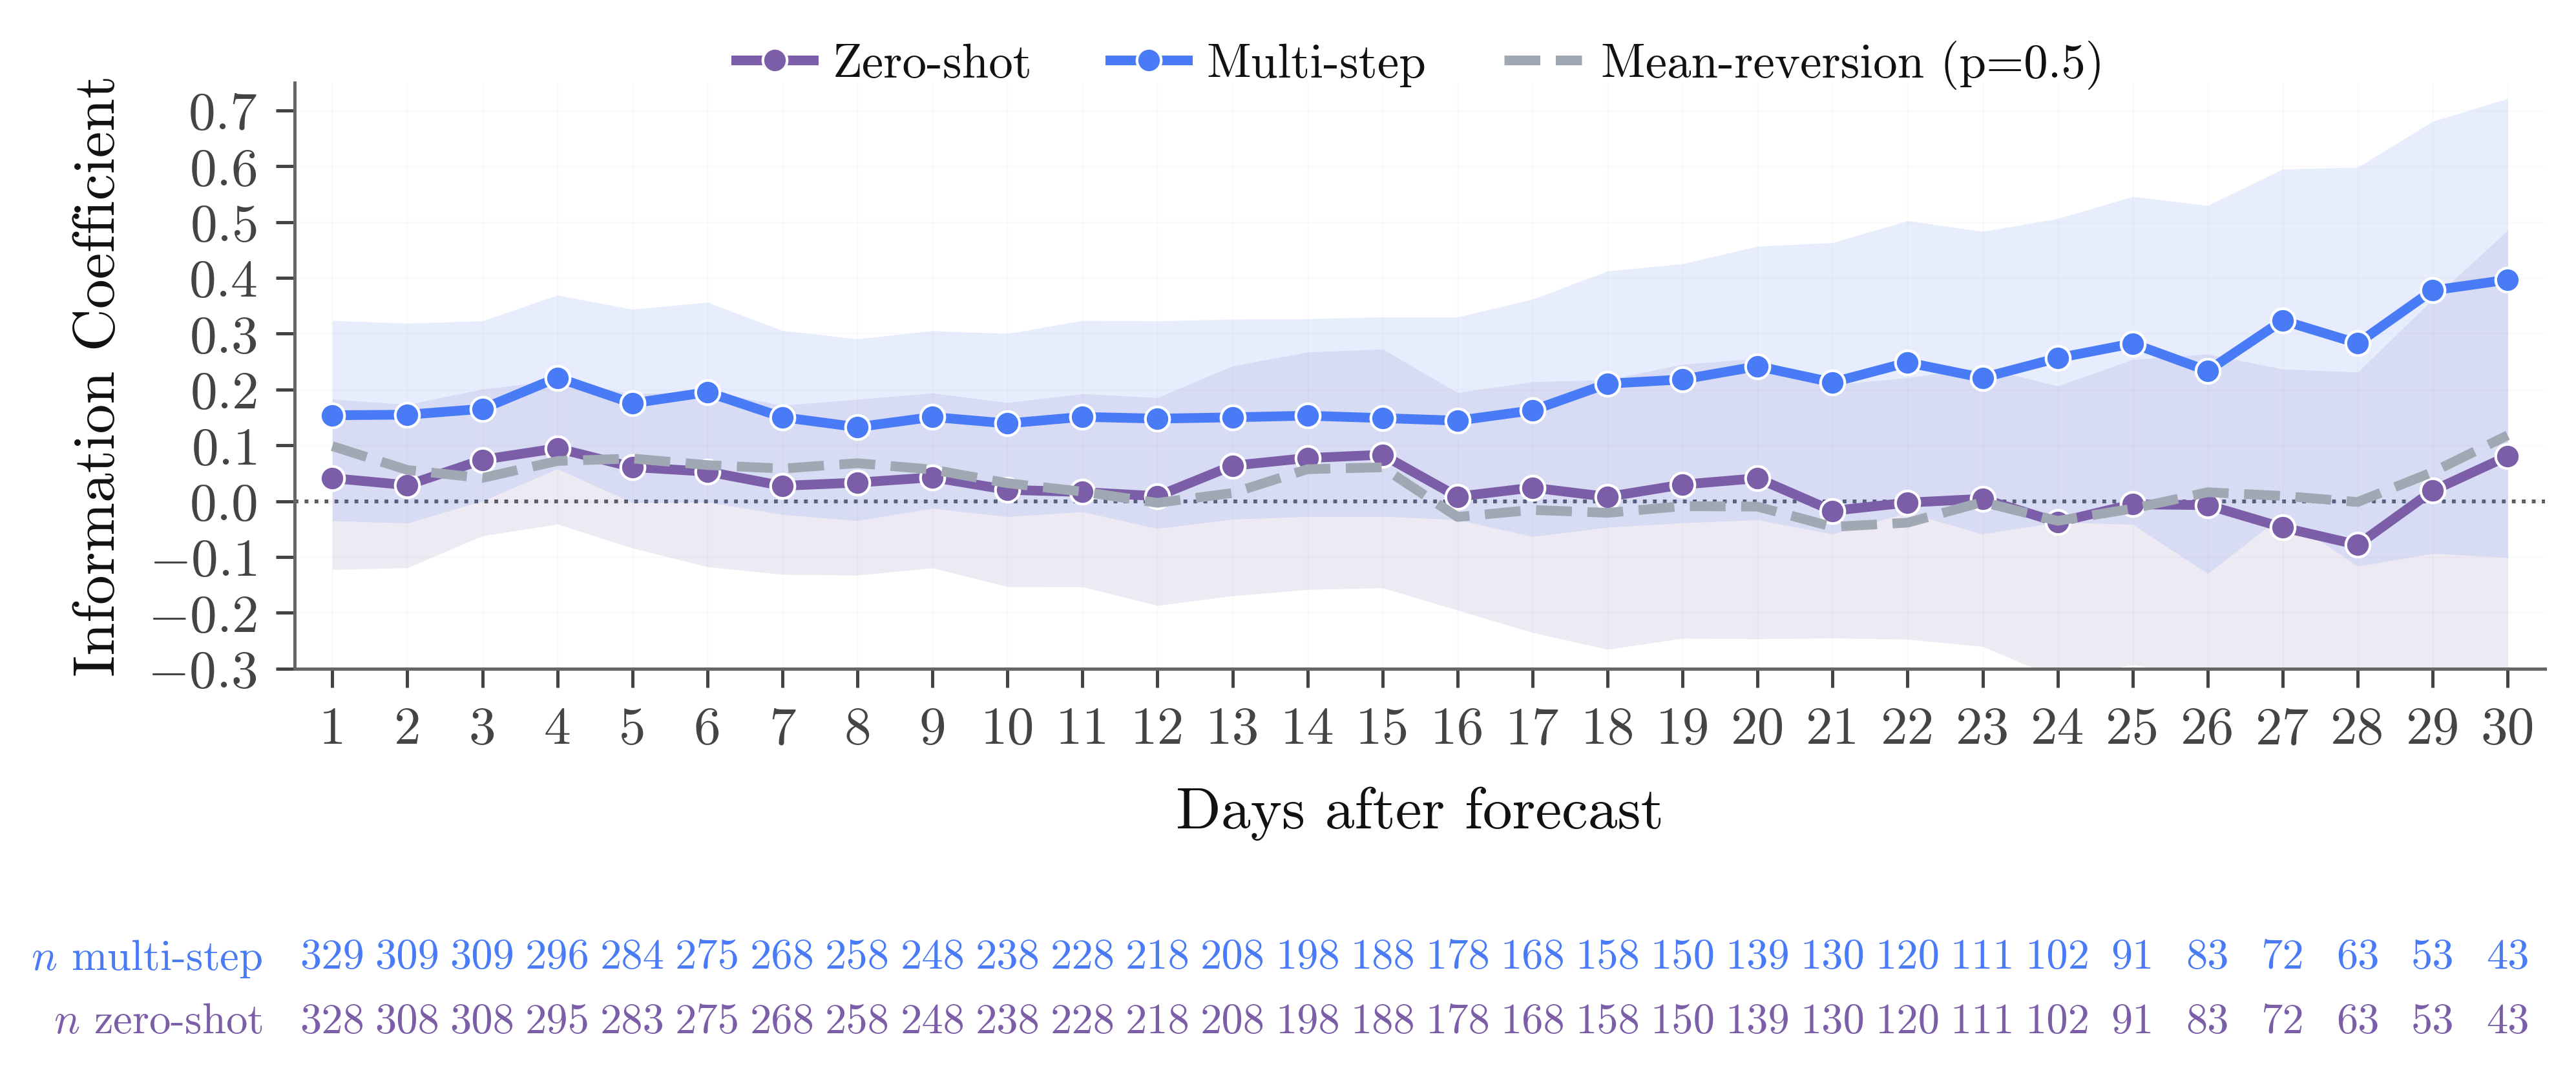
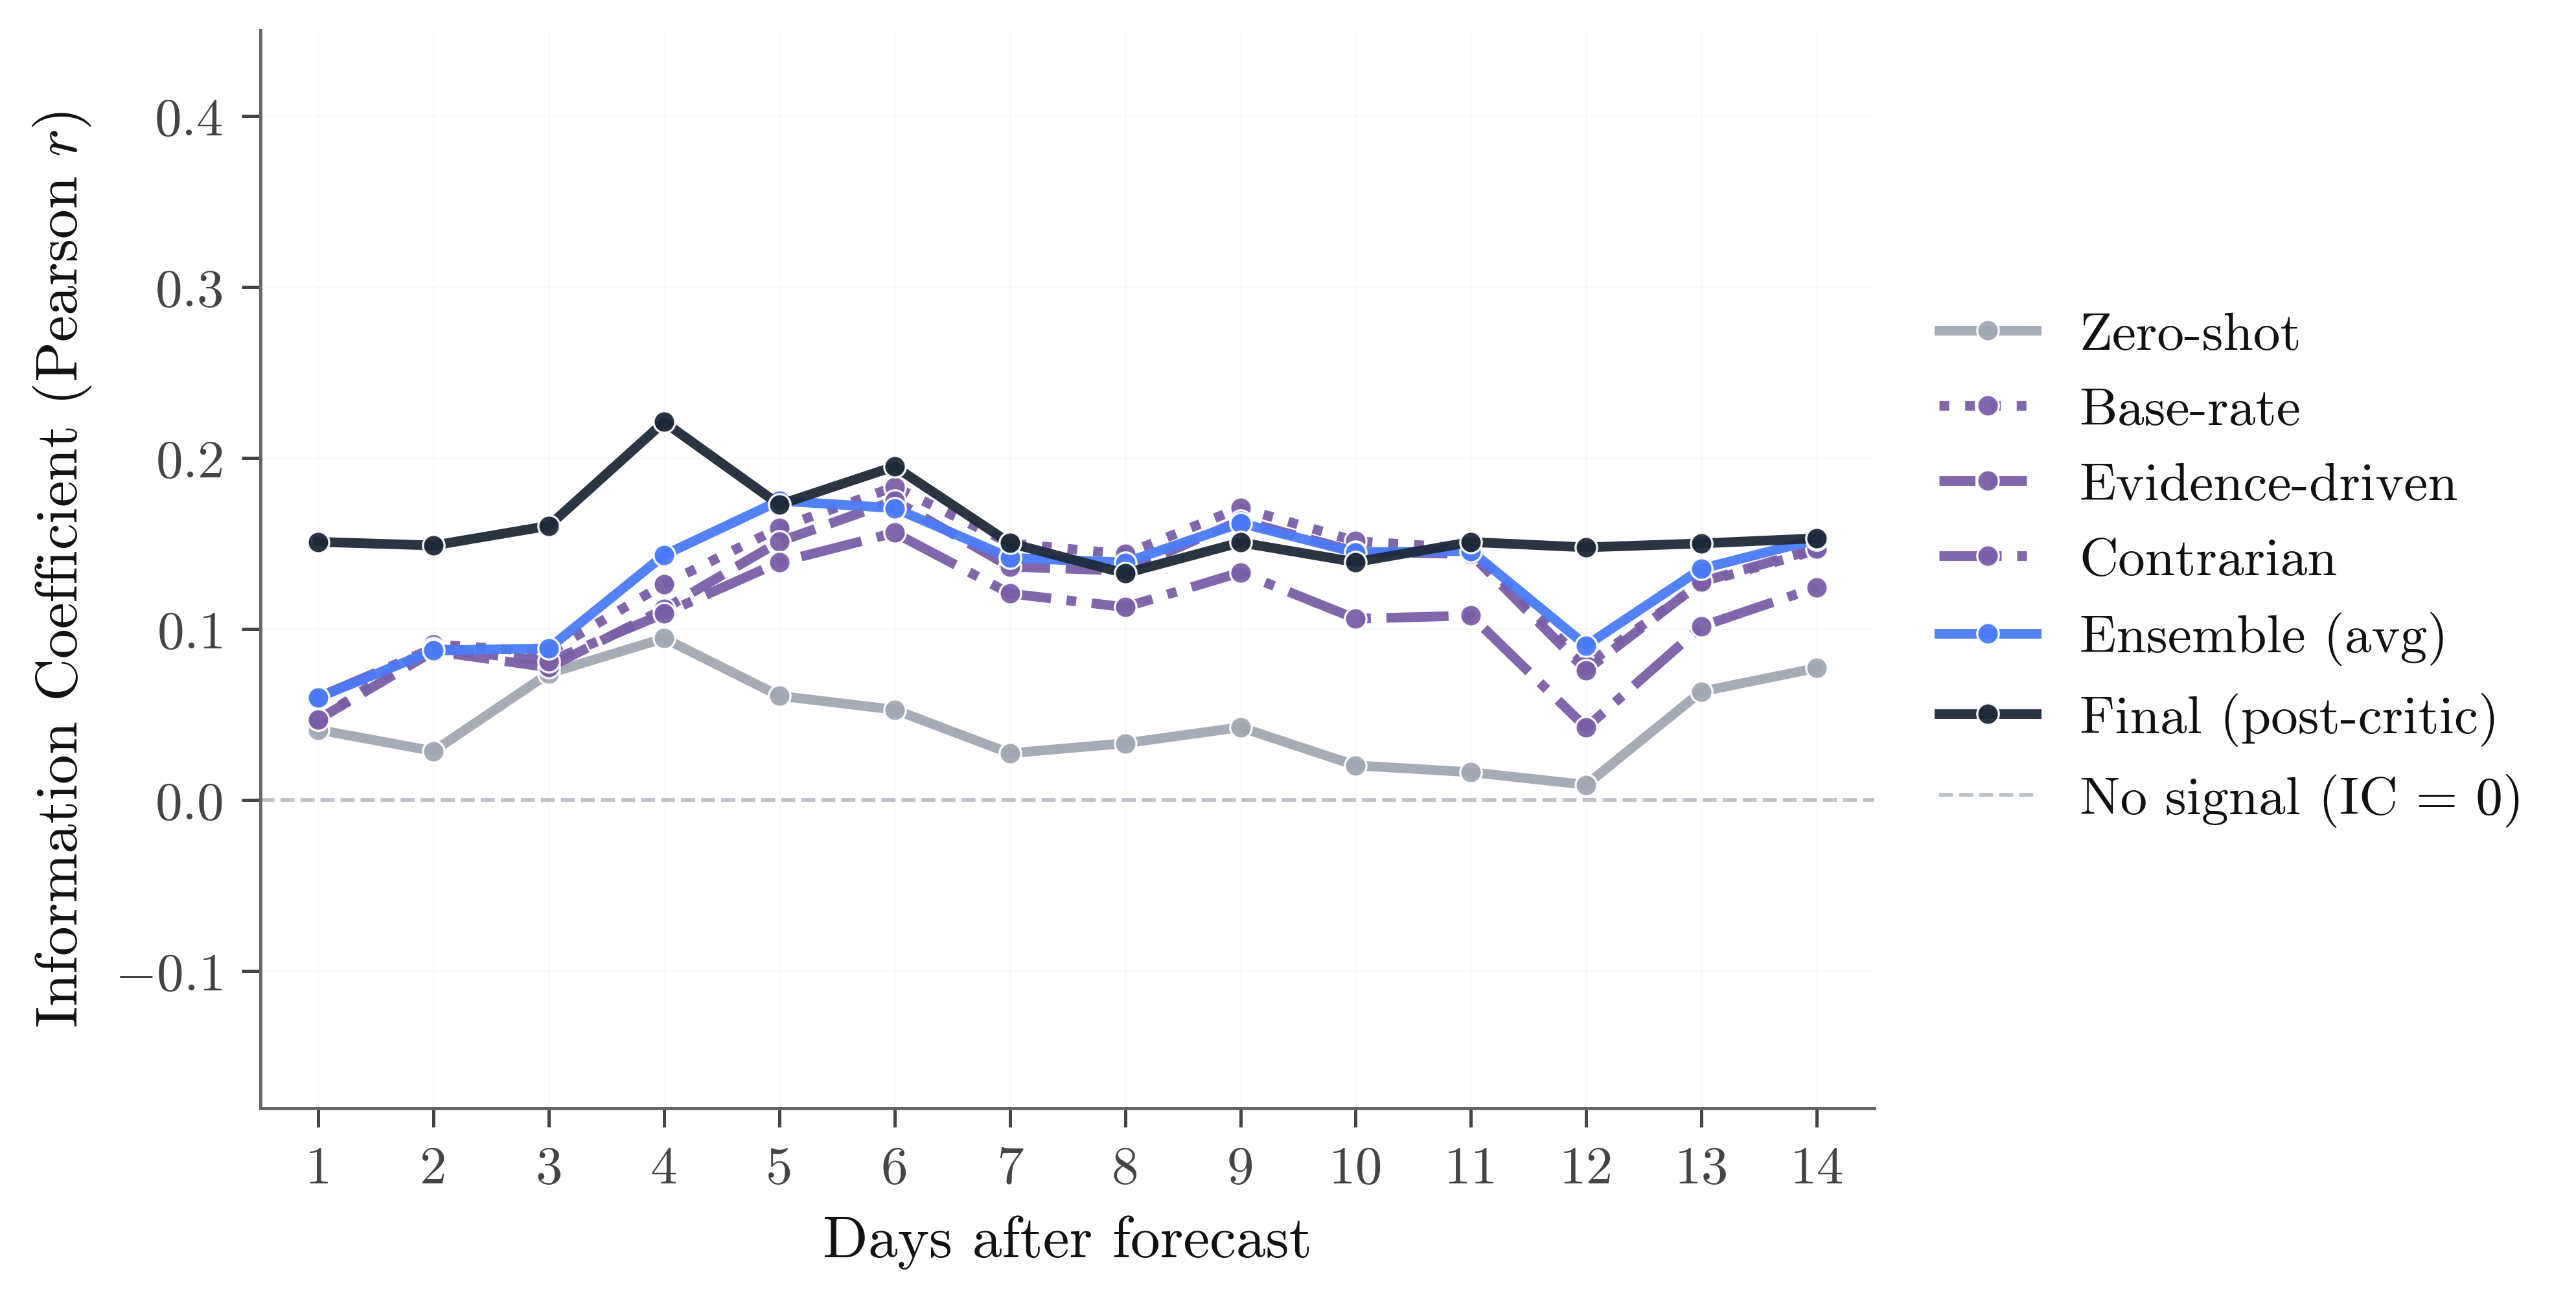
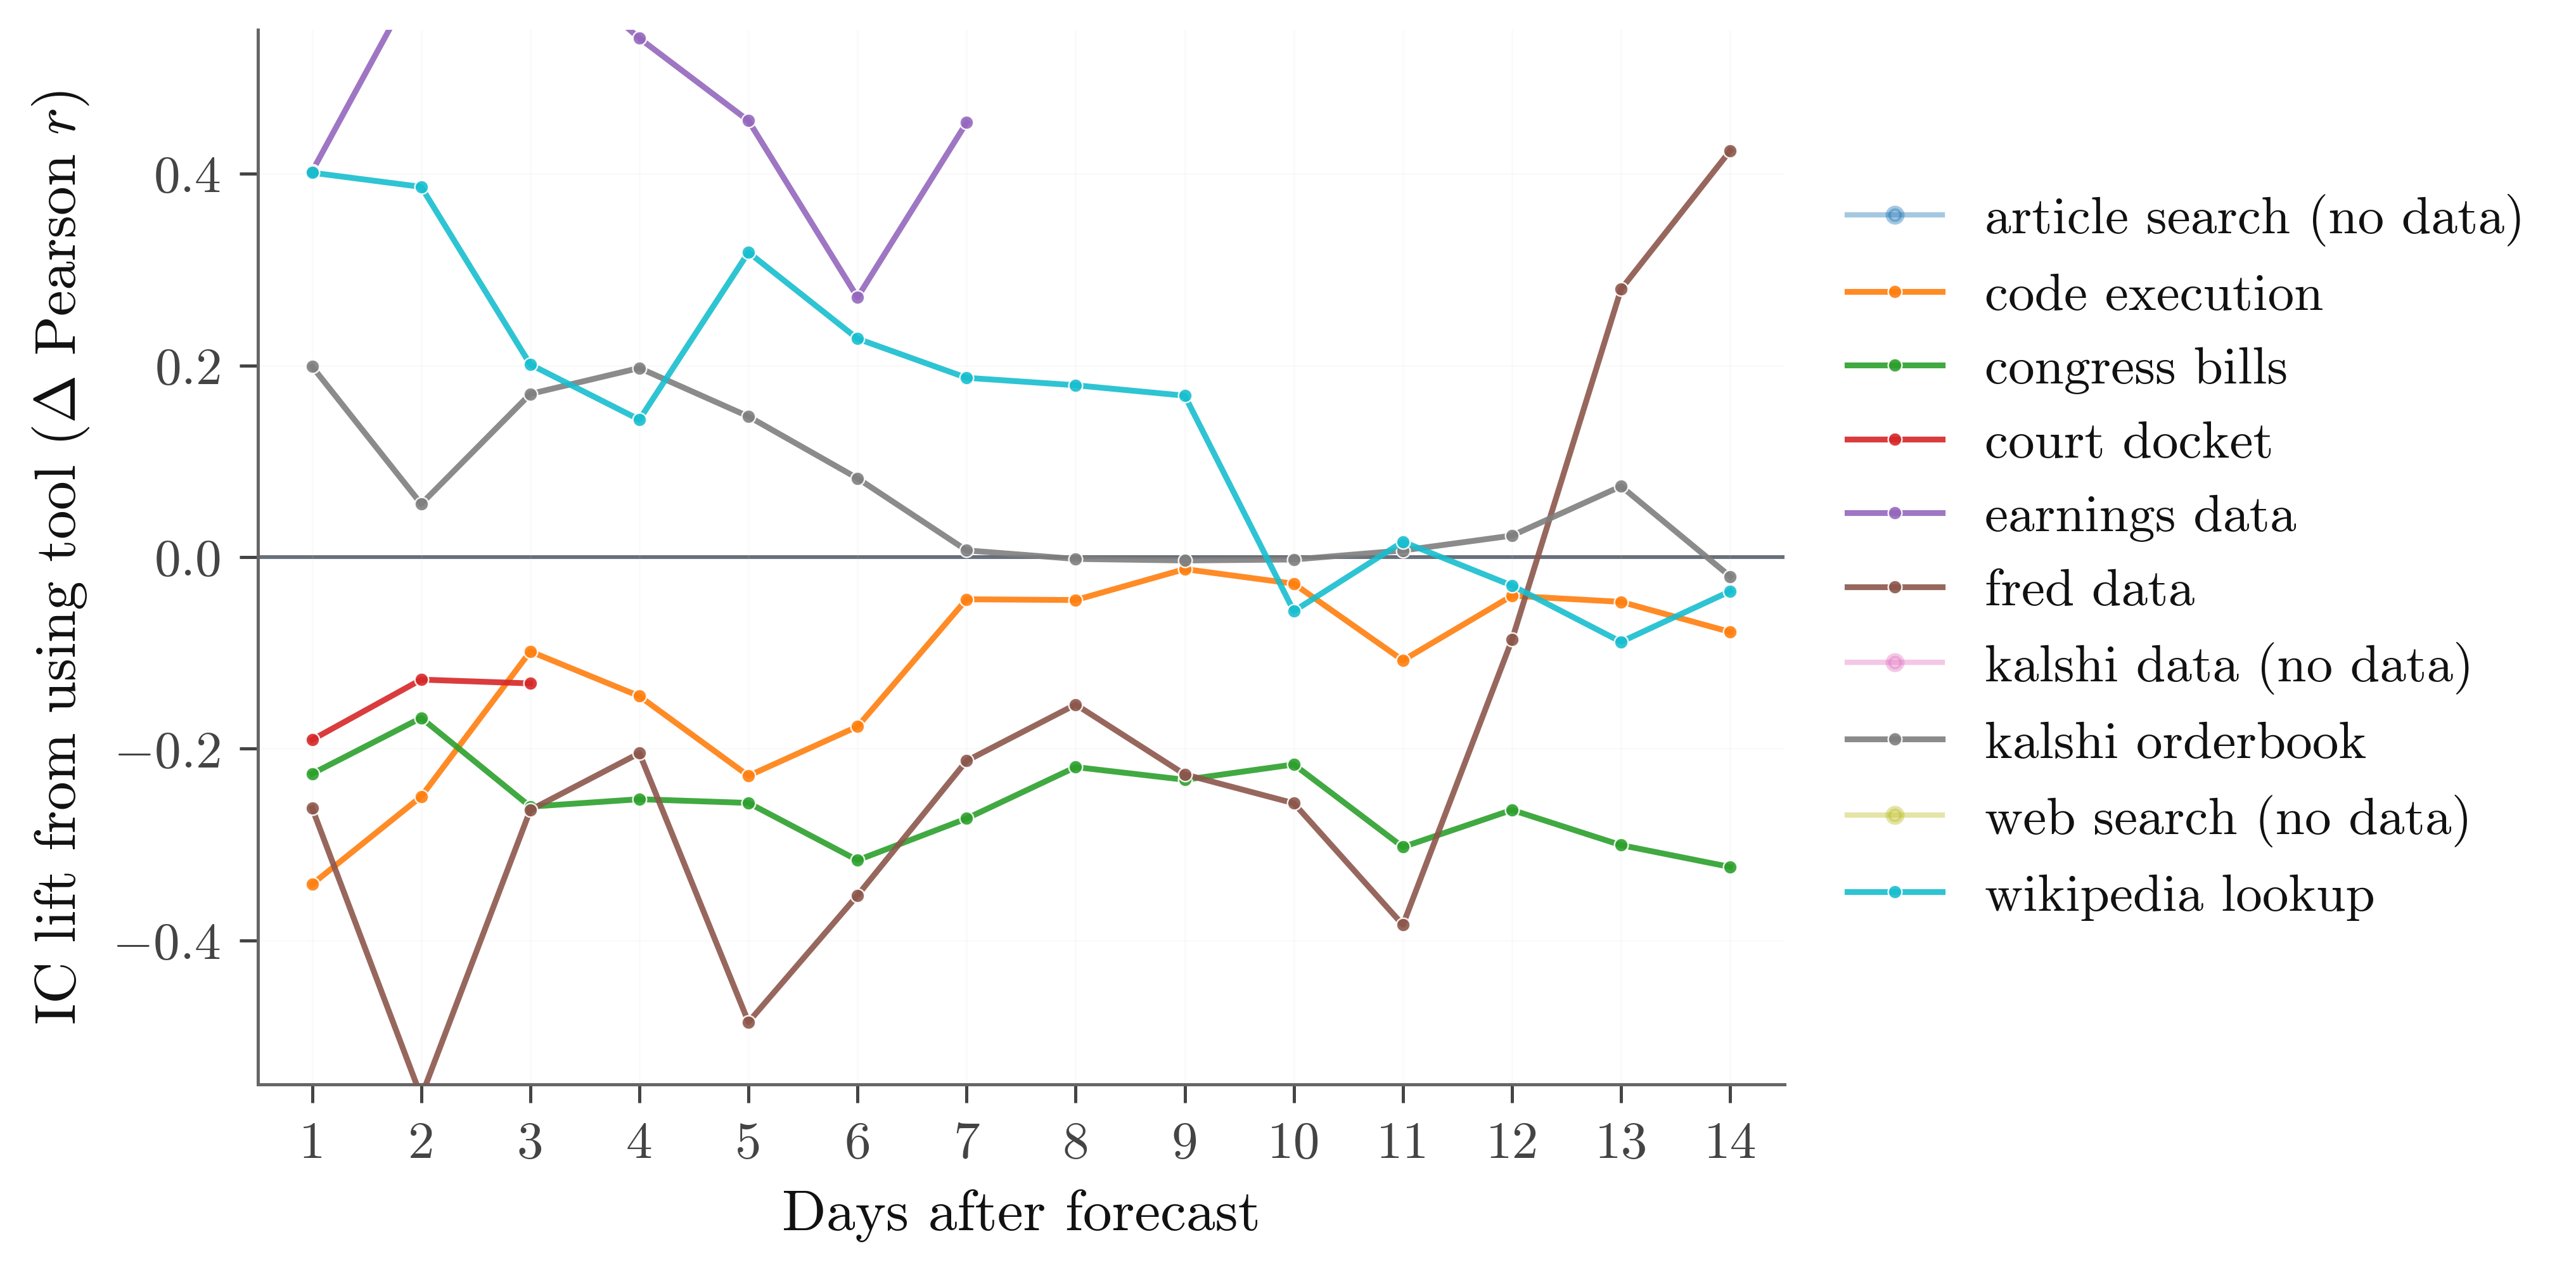
Four charts carry the paper's main story. They answer, in order: does our agent beat a simple baseline? · which stage of the pipeline did the work? · which research tool did the work? · does the critic stage actually help, or just hug the market?
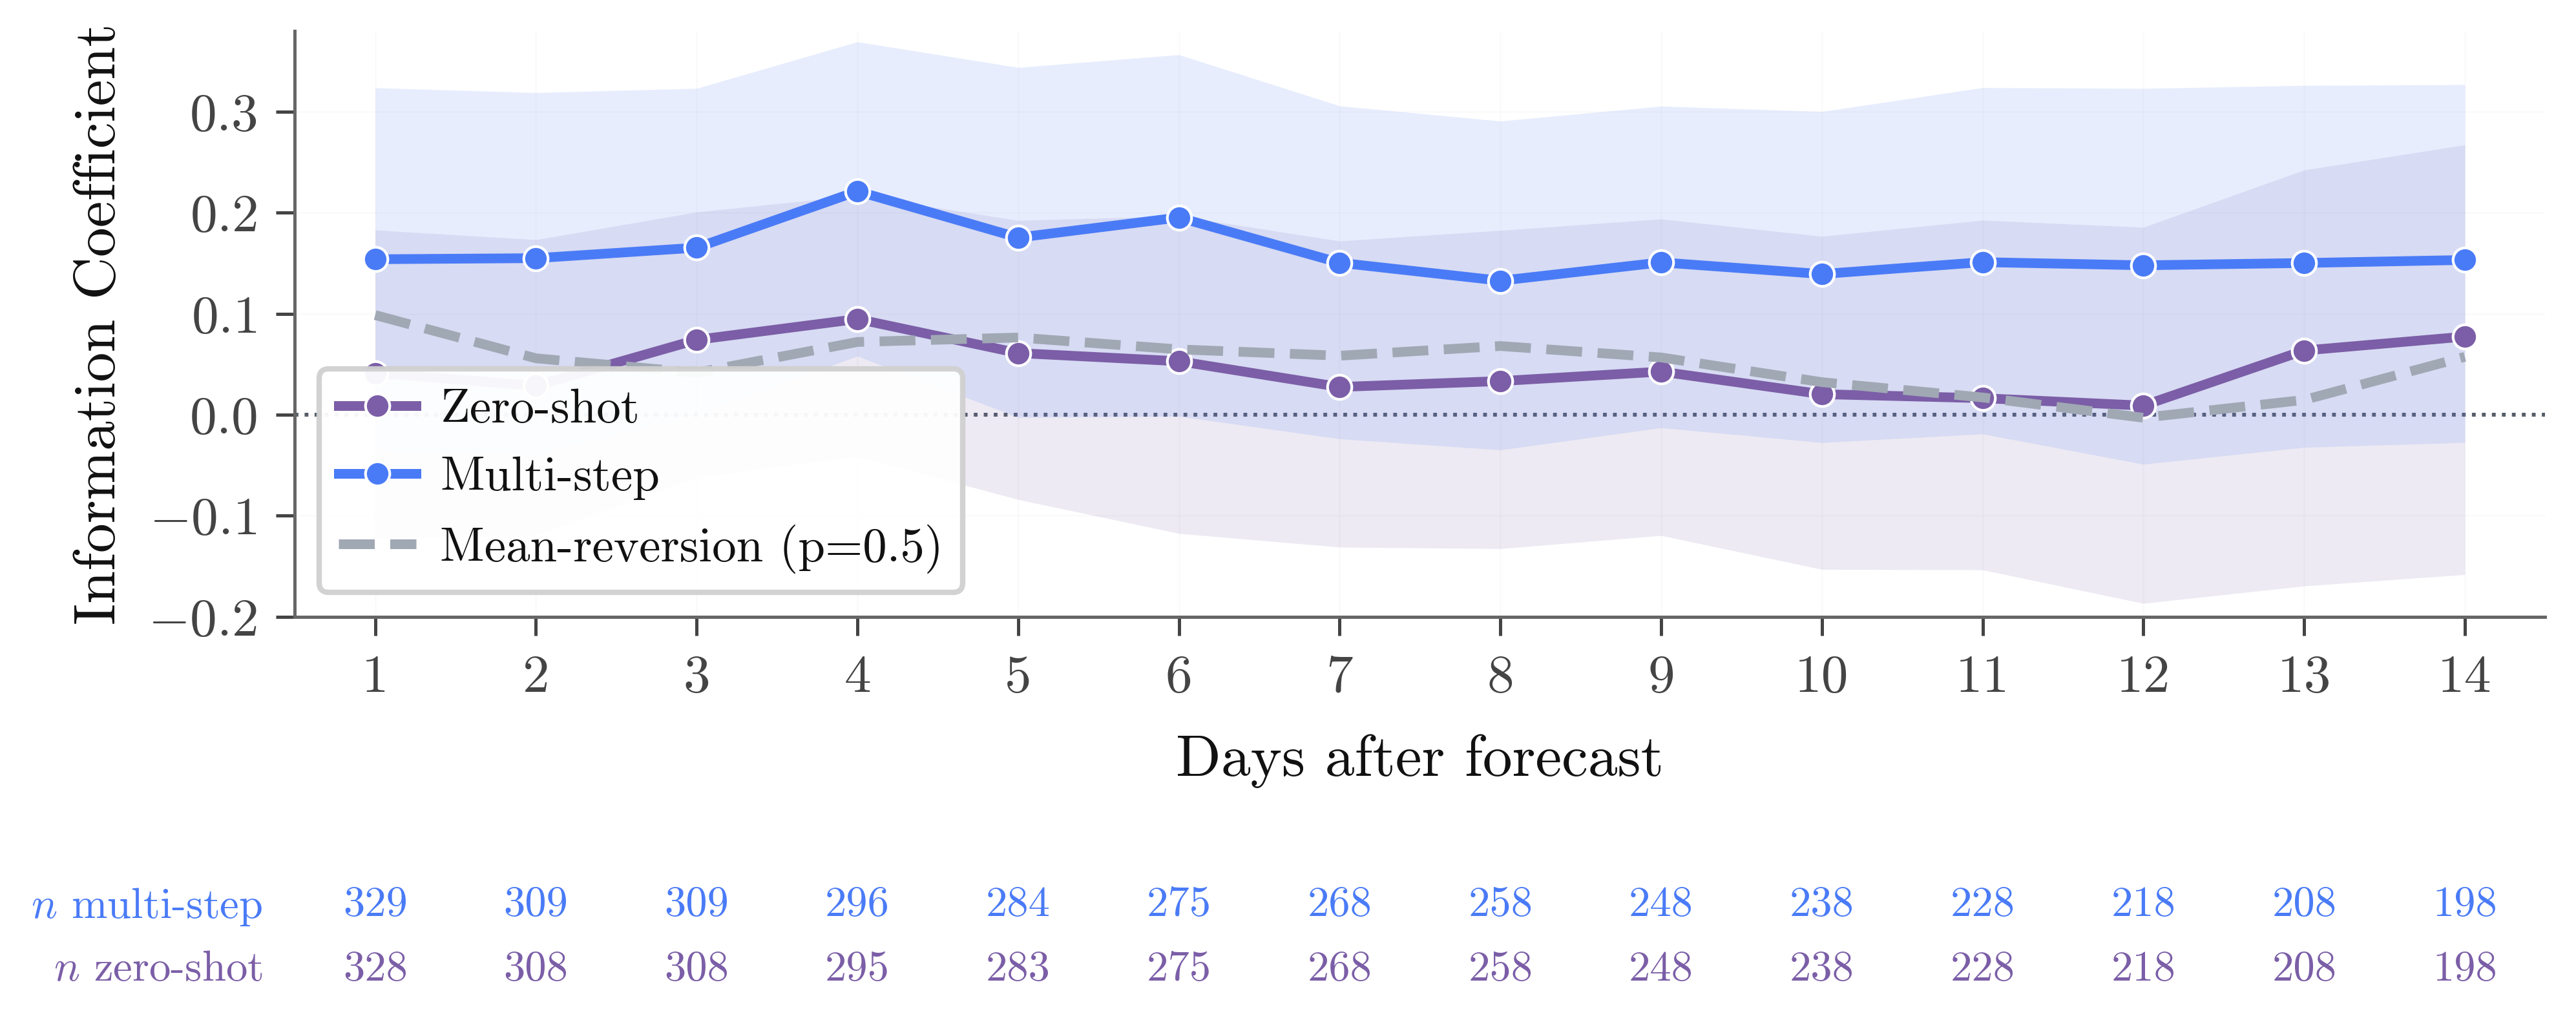
Multi-step averages IC +0.17 across t+1 through t+14 vs. +0.02 for zero-shot and +0.04 for mean-reversion. The multi-step pipeline beats both baselines at every horizon, and the gap widens at longer horizons.
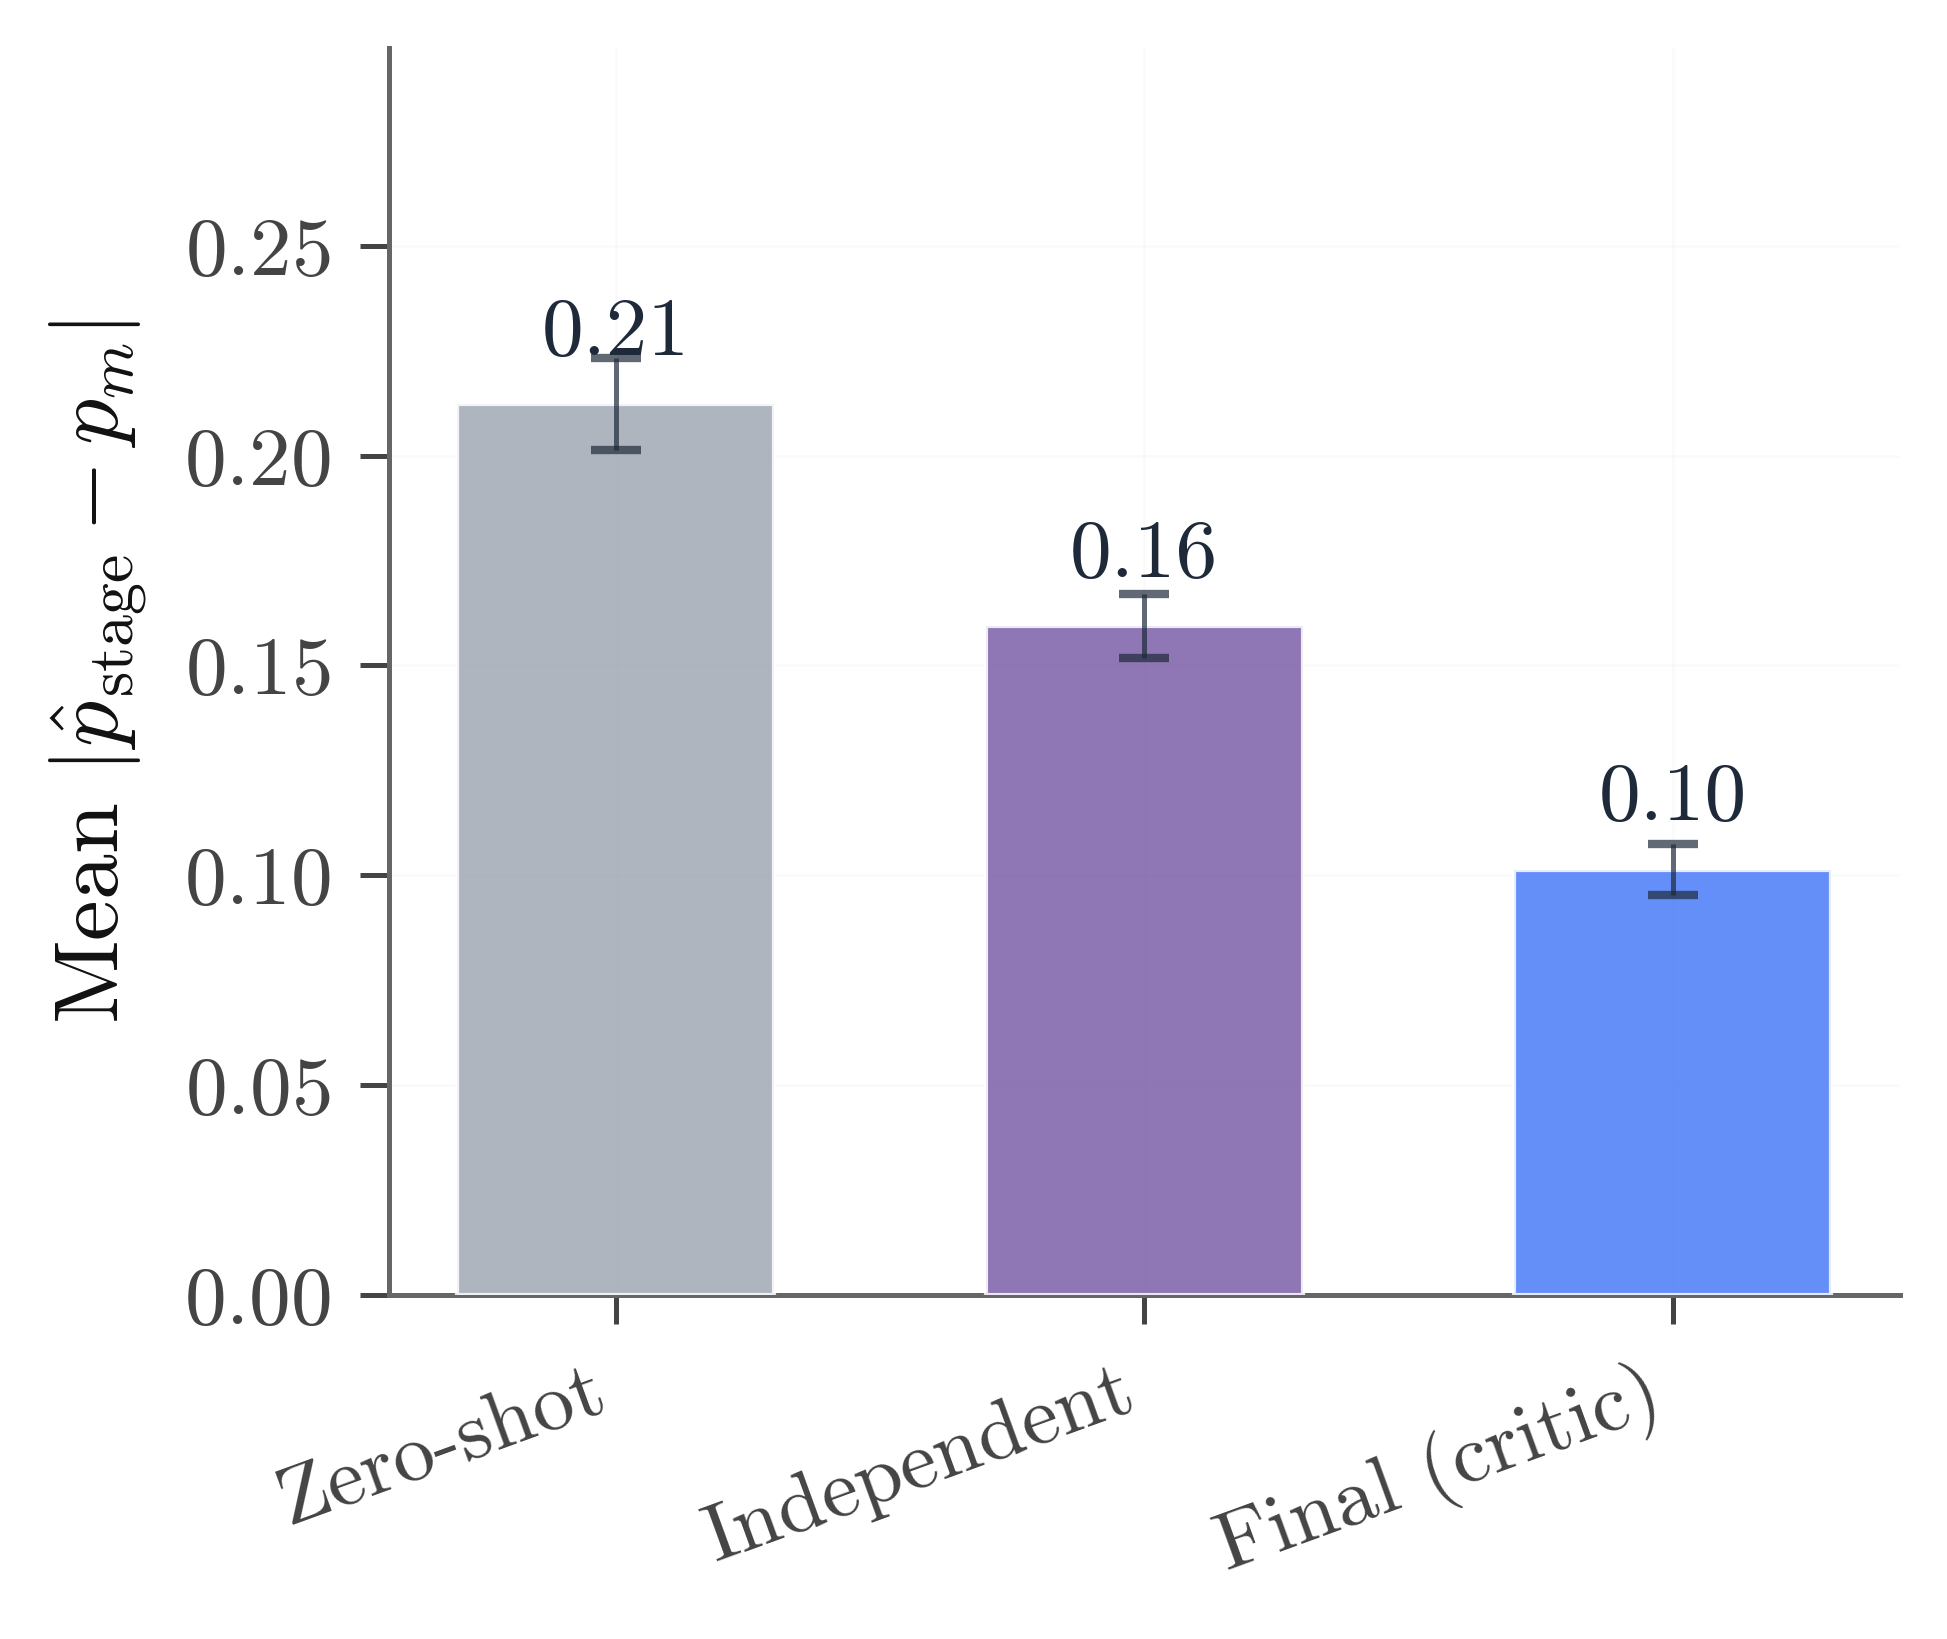
Supporting evidence
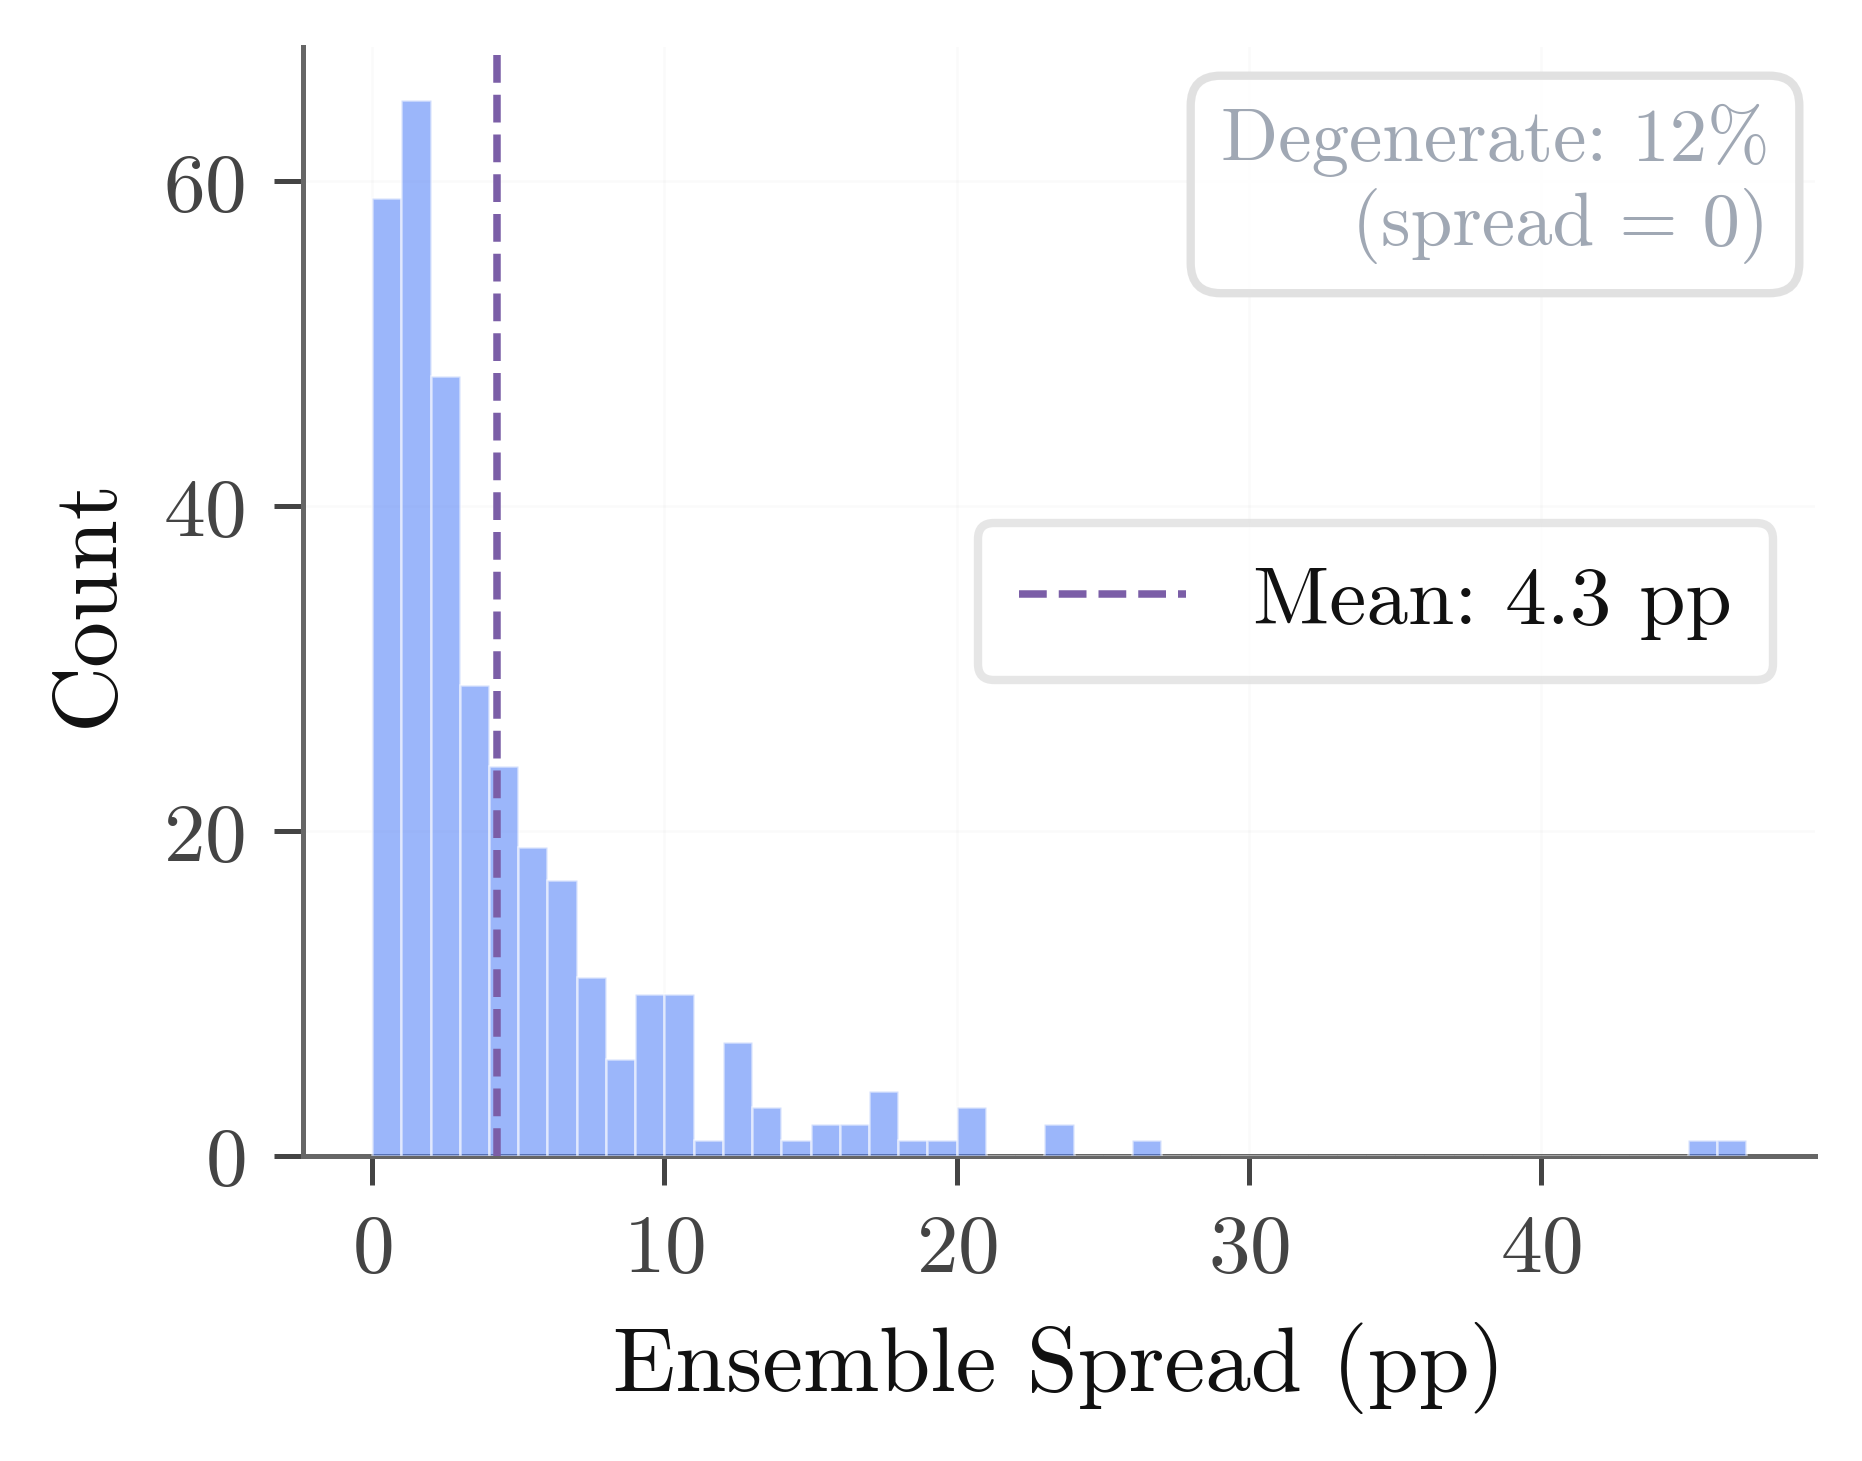
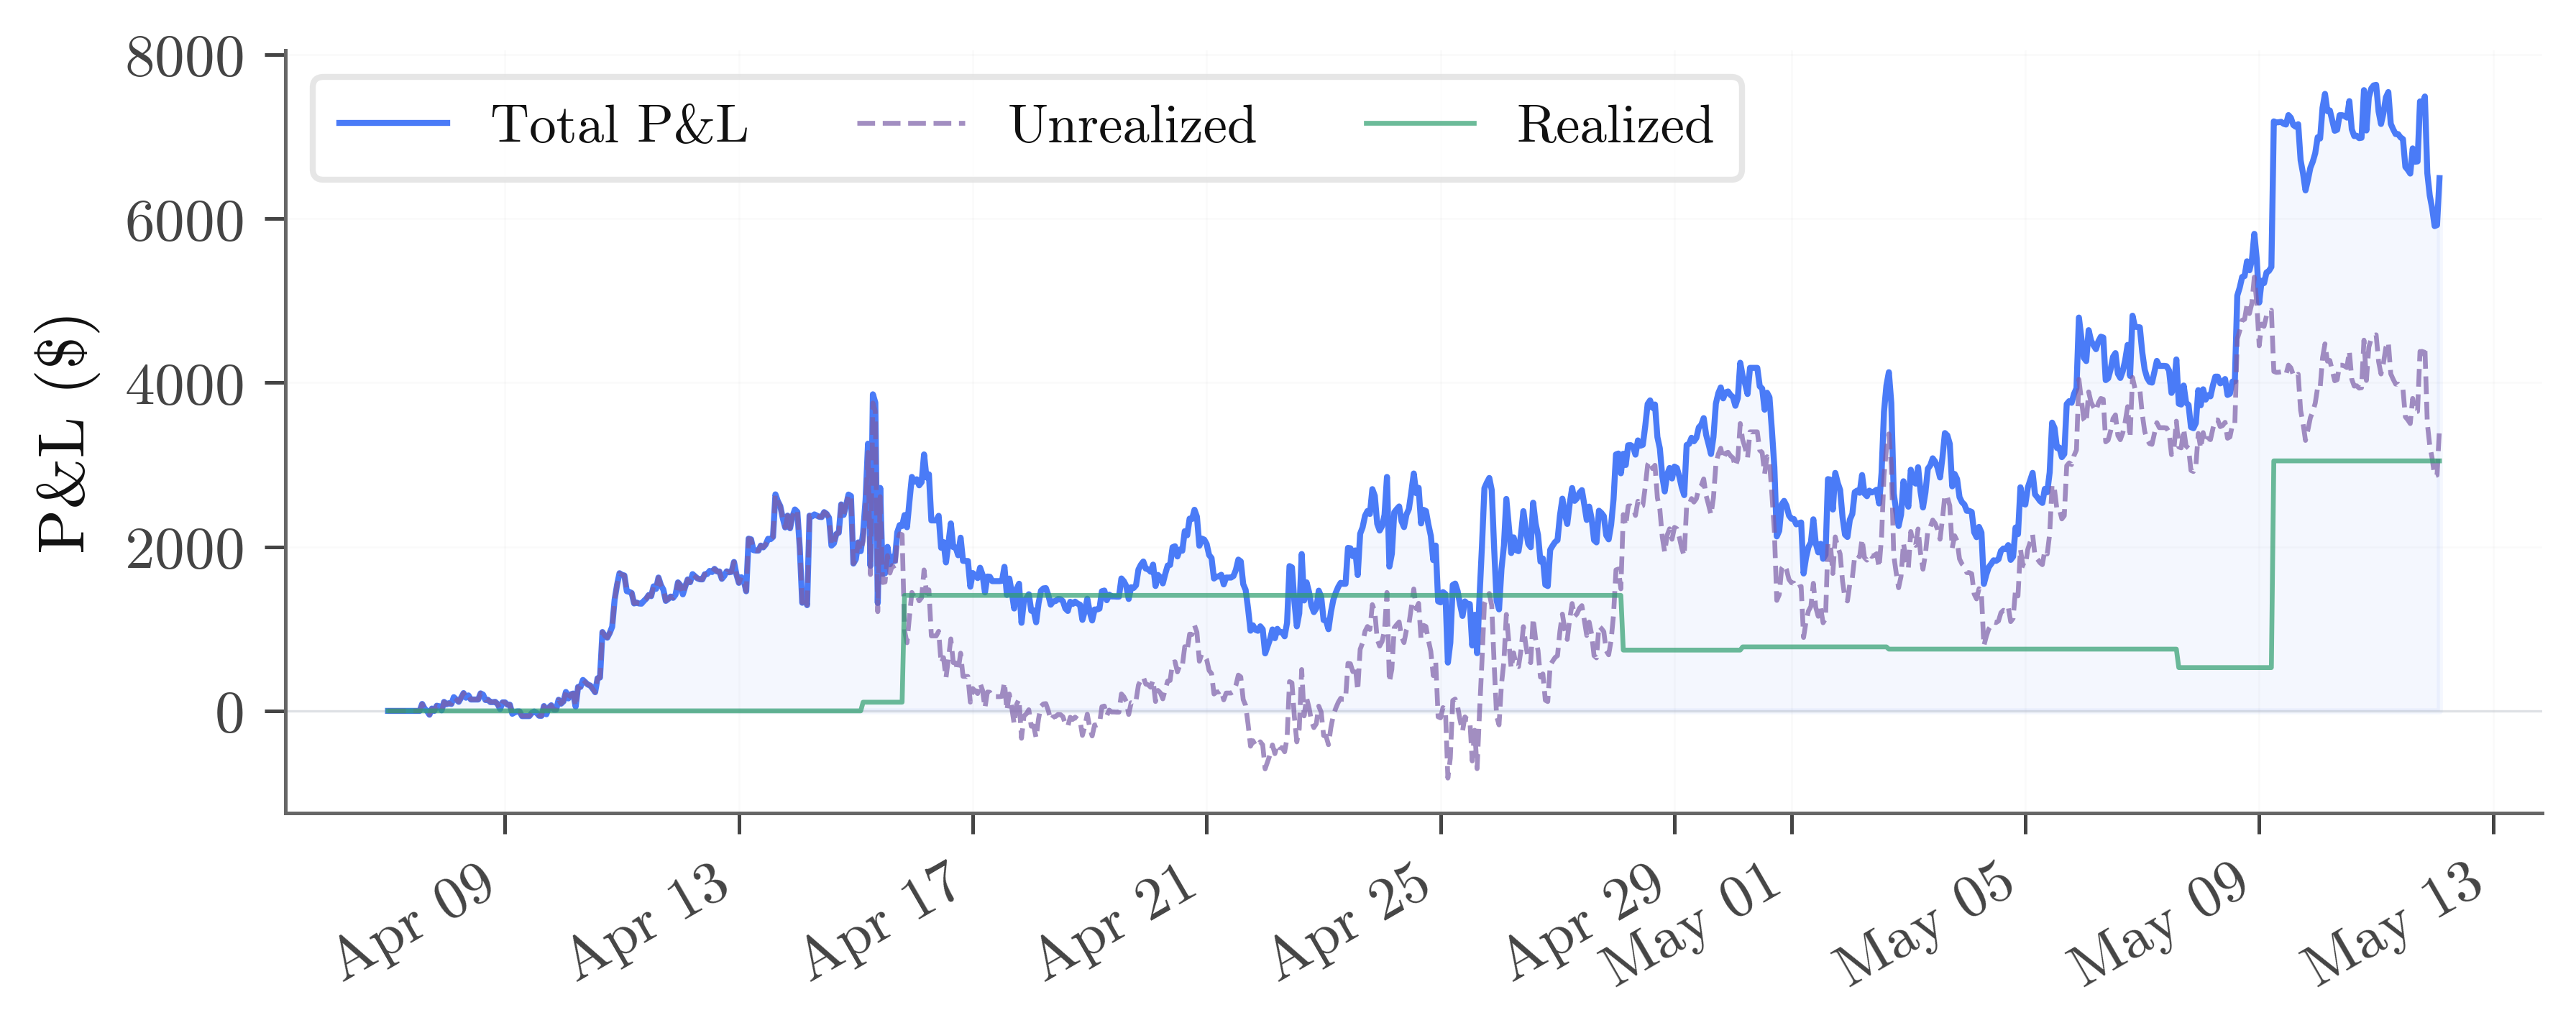
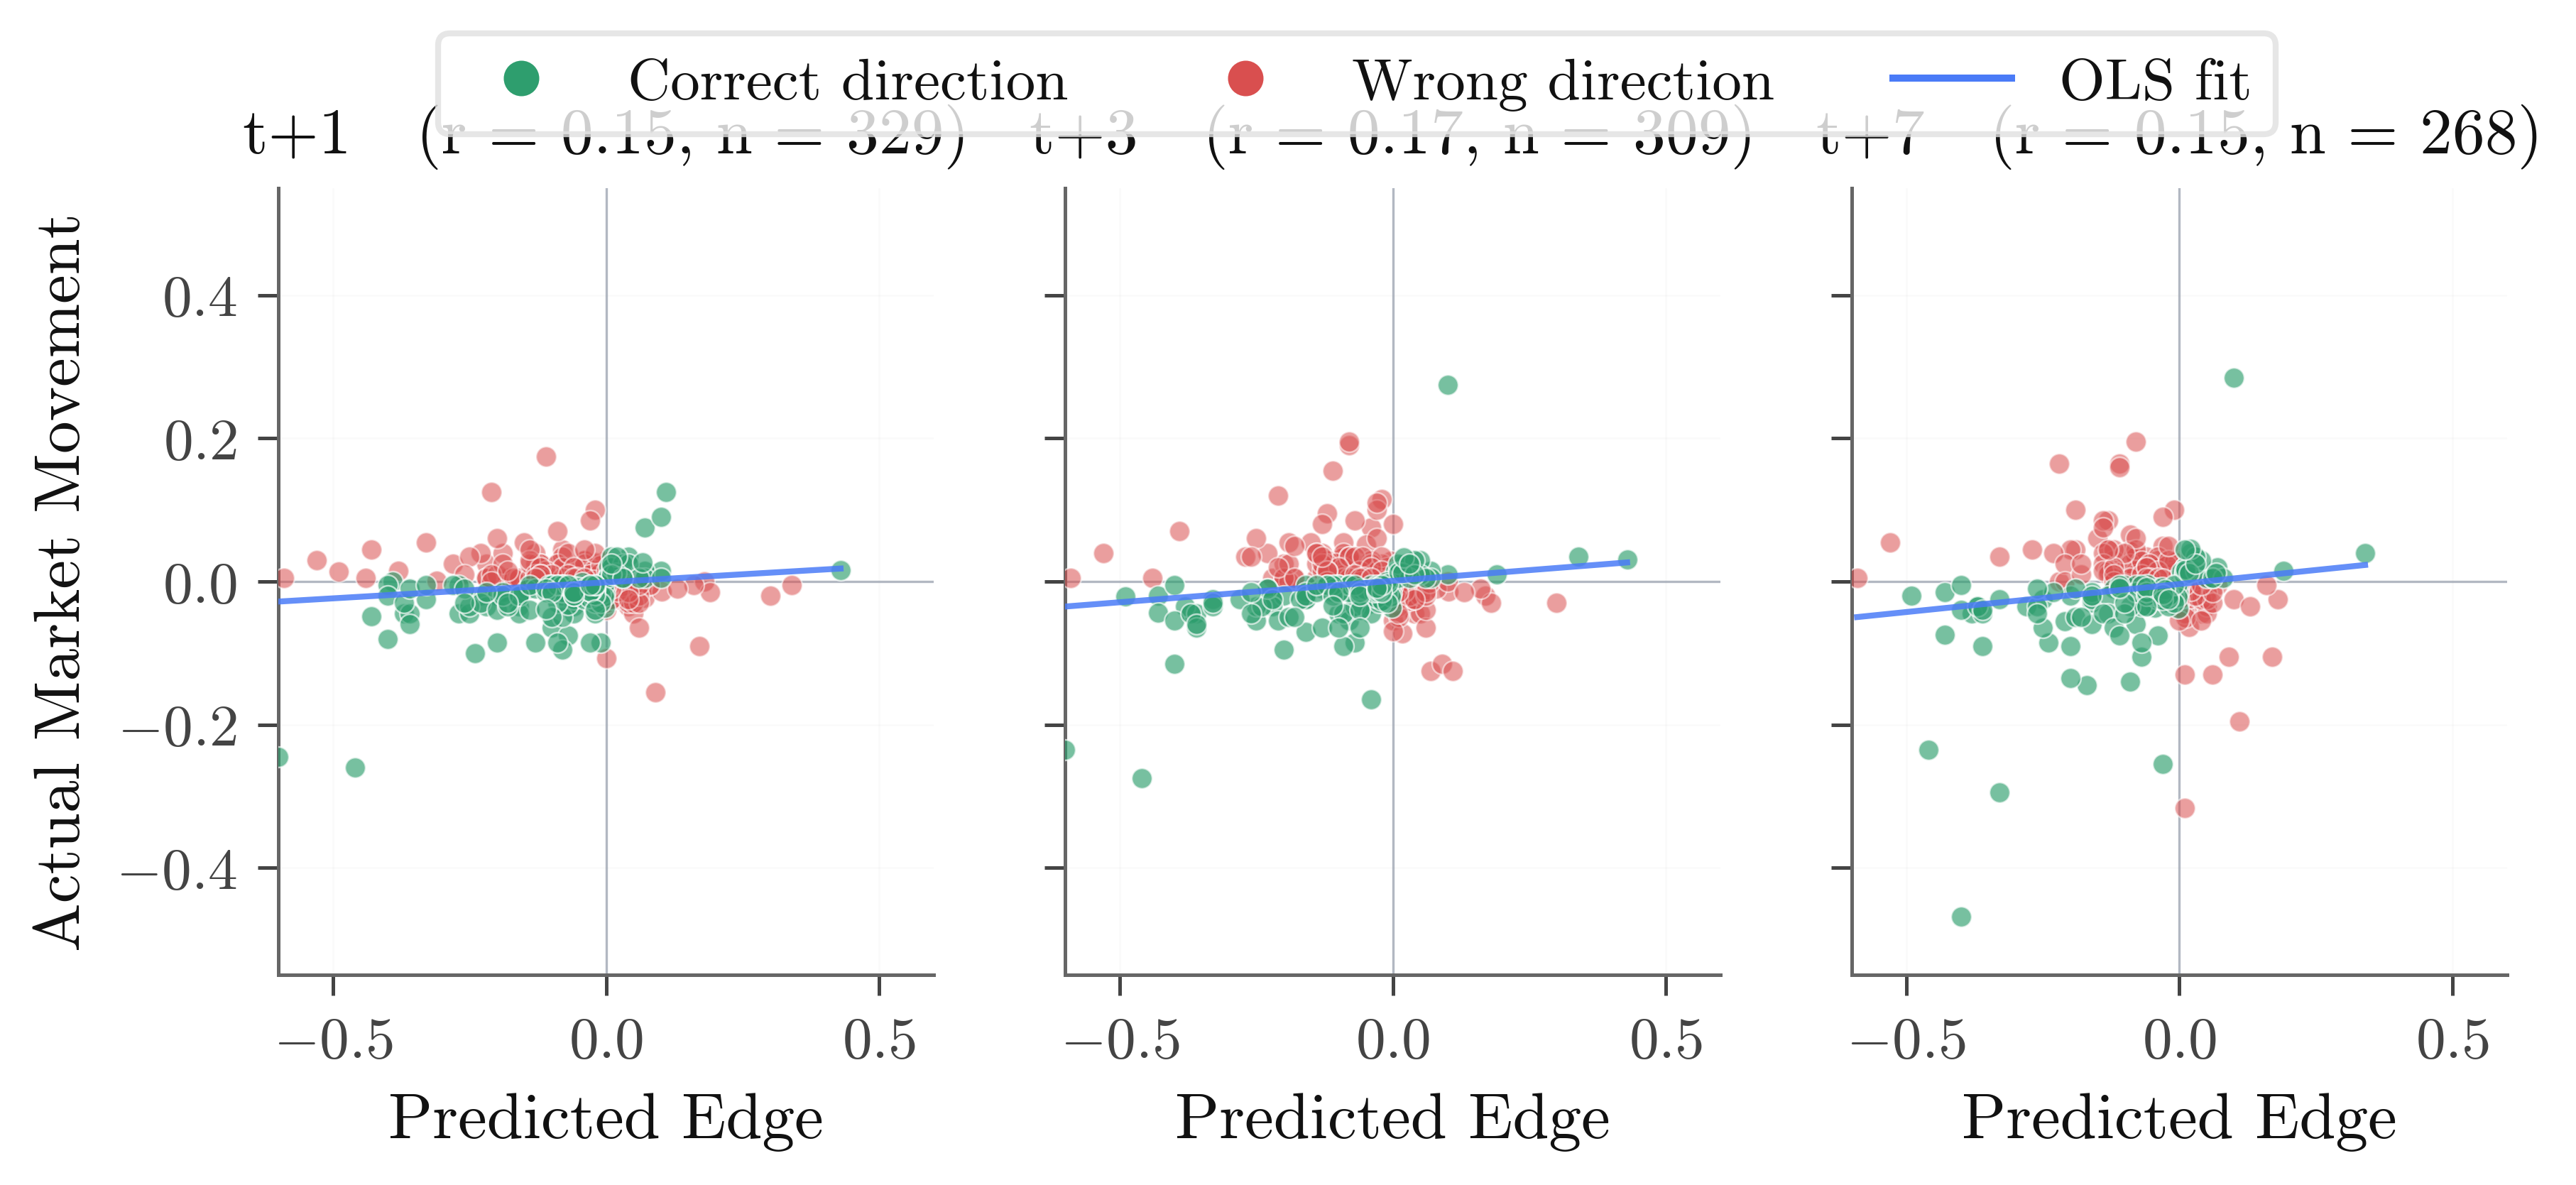
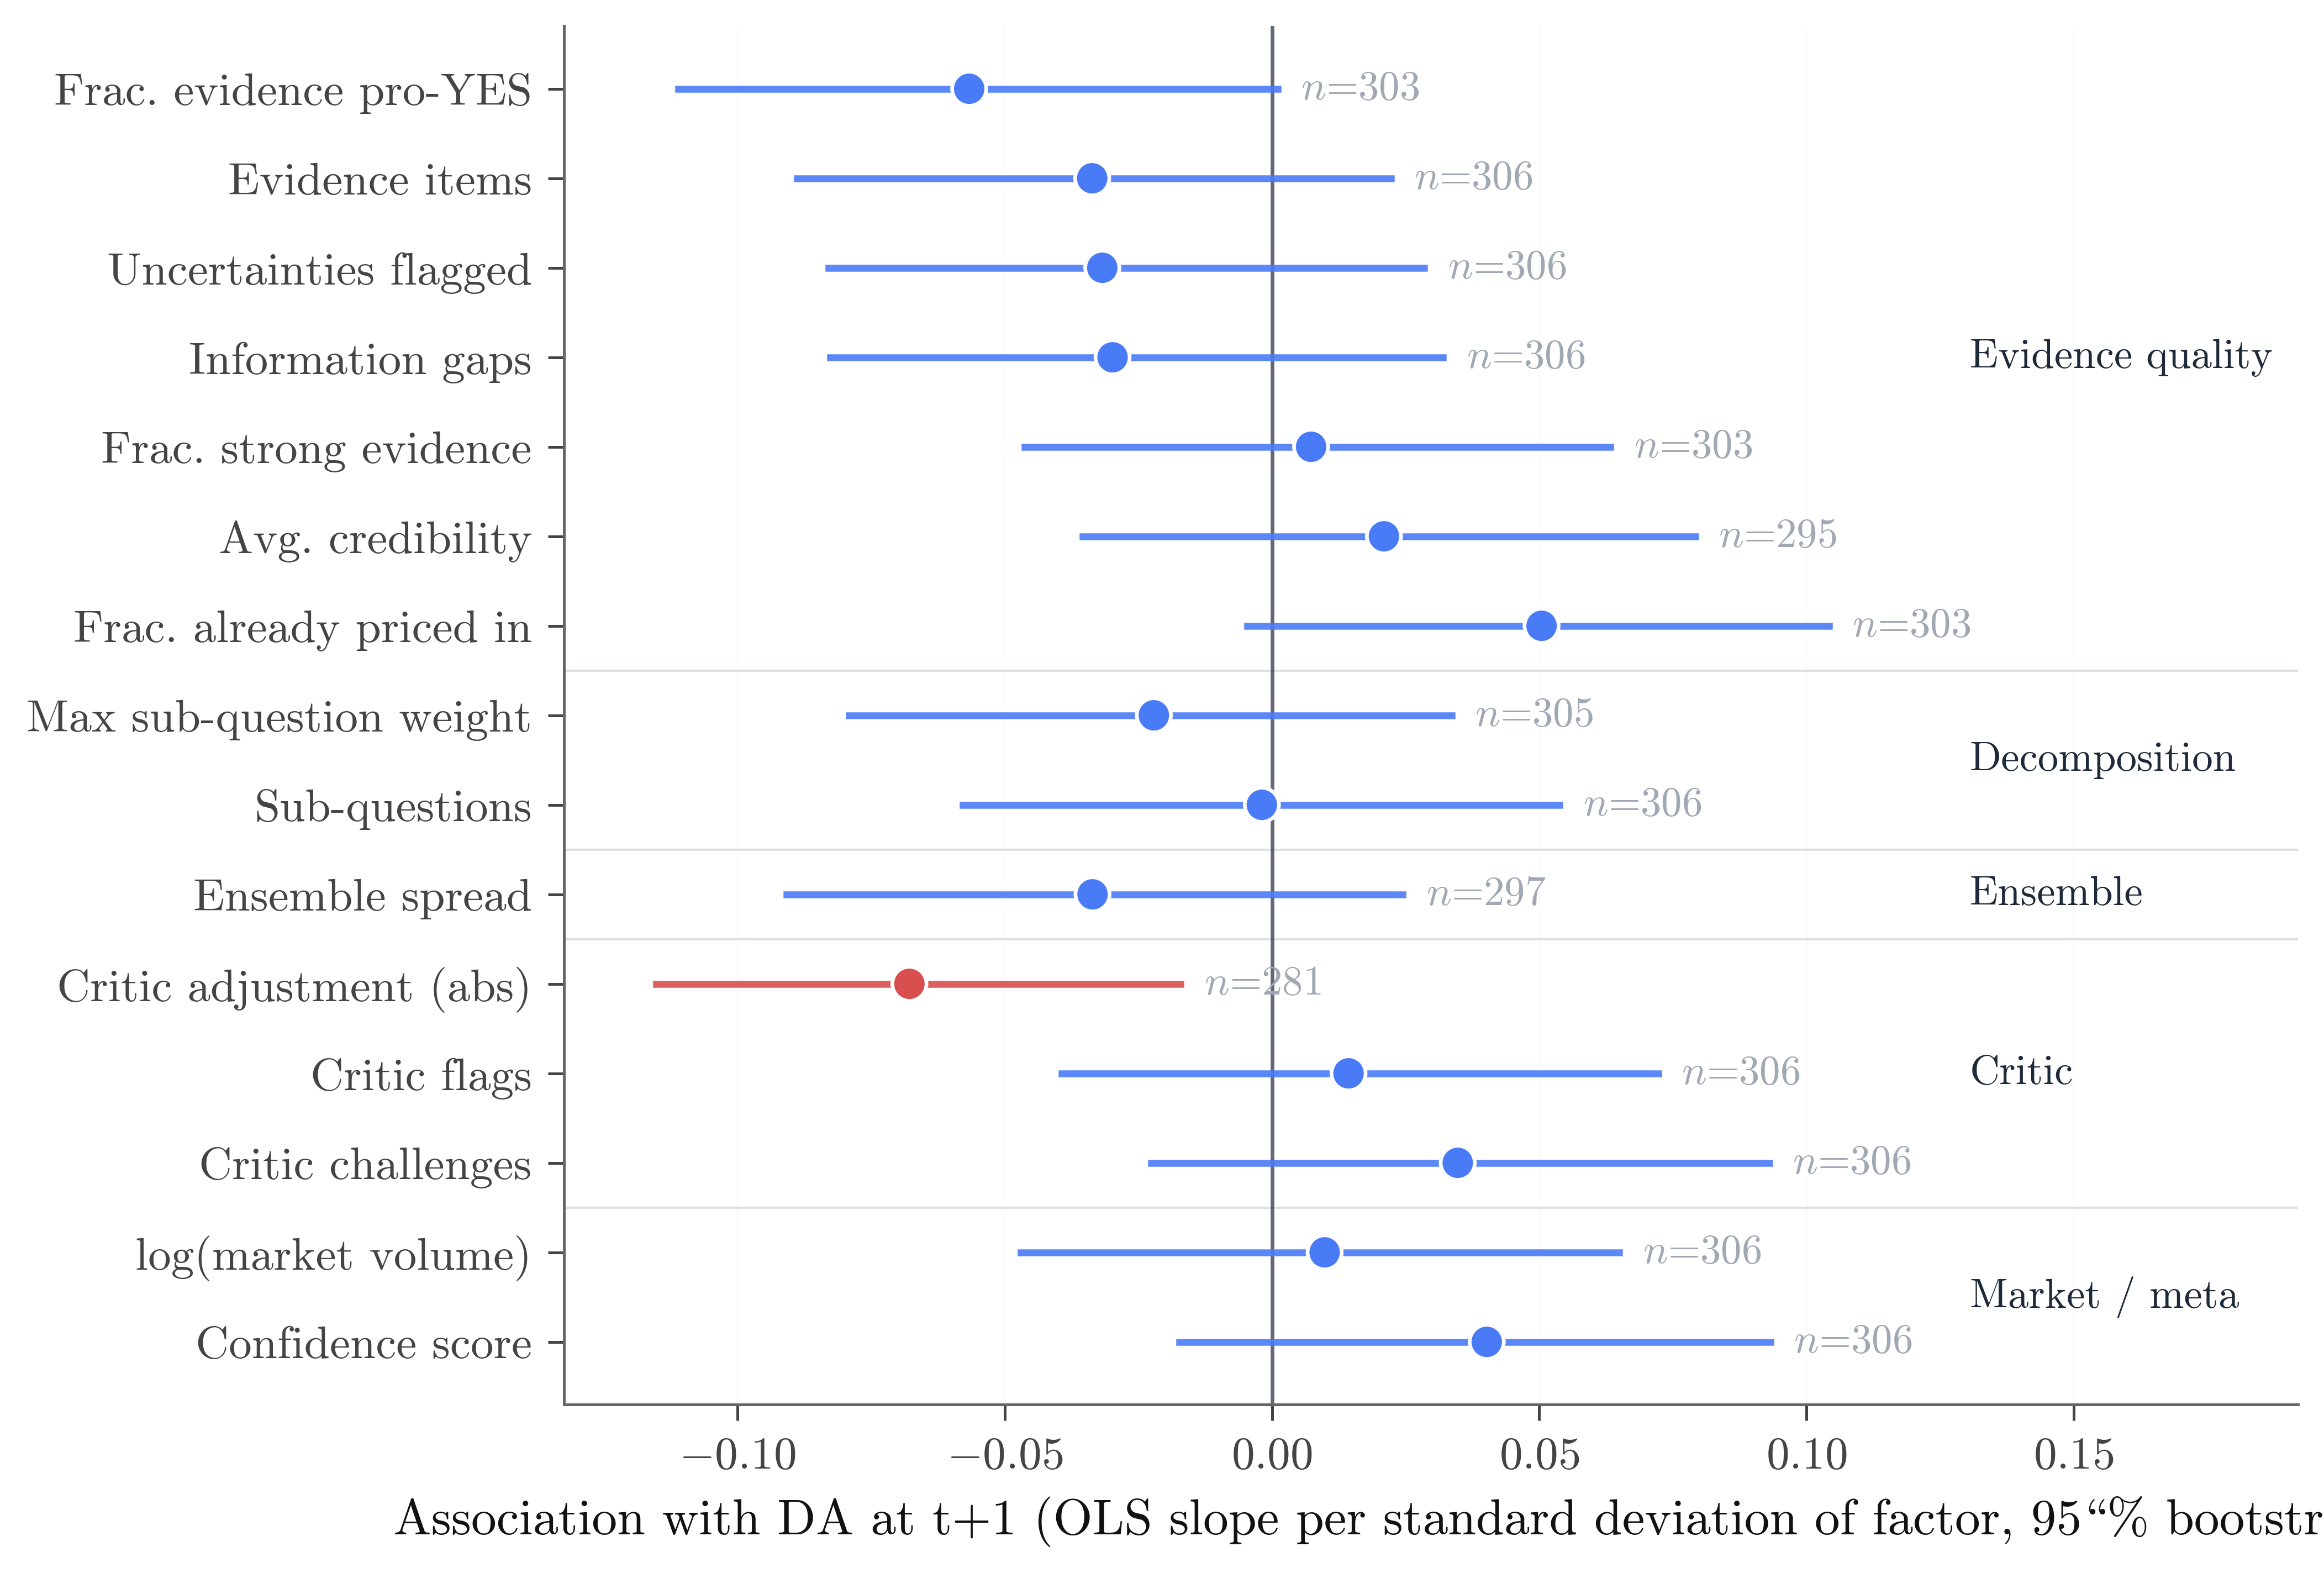
Diagnostic panels that back up the headline story: the ensemble's diversity collapse, the cumulative paper-trading P&L (an economic-value sanity check on the IC lift), the relationship between forecast magnitude and subsequent movement, and a regression forest plot of every non-tool factor.
Directional accuracy companions
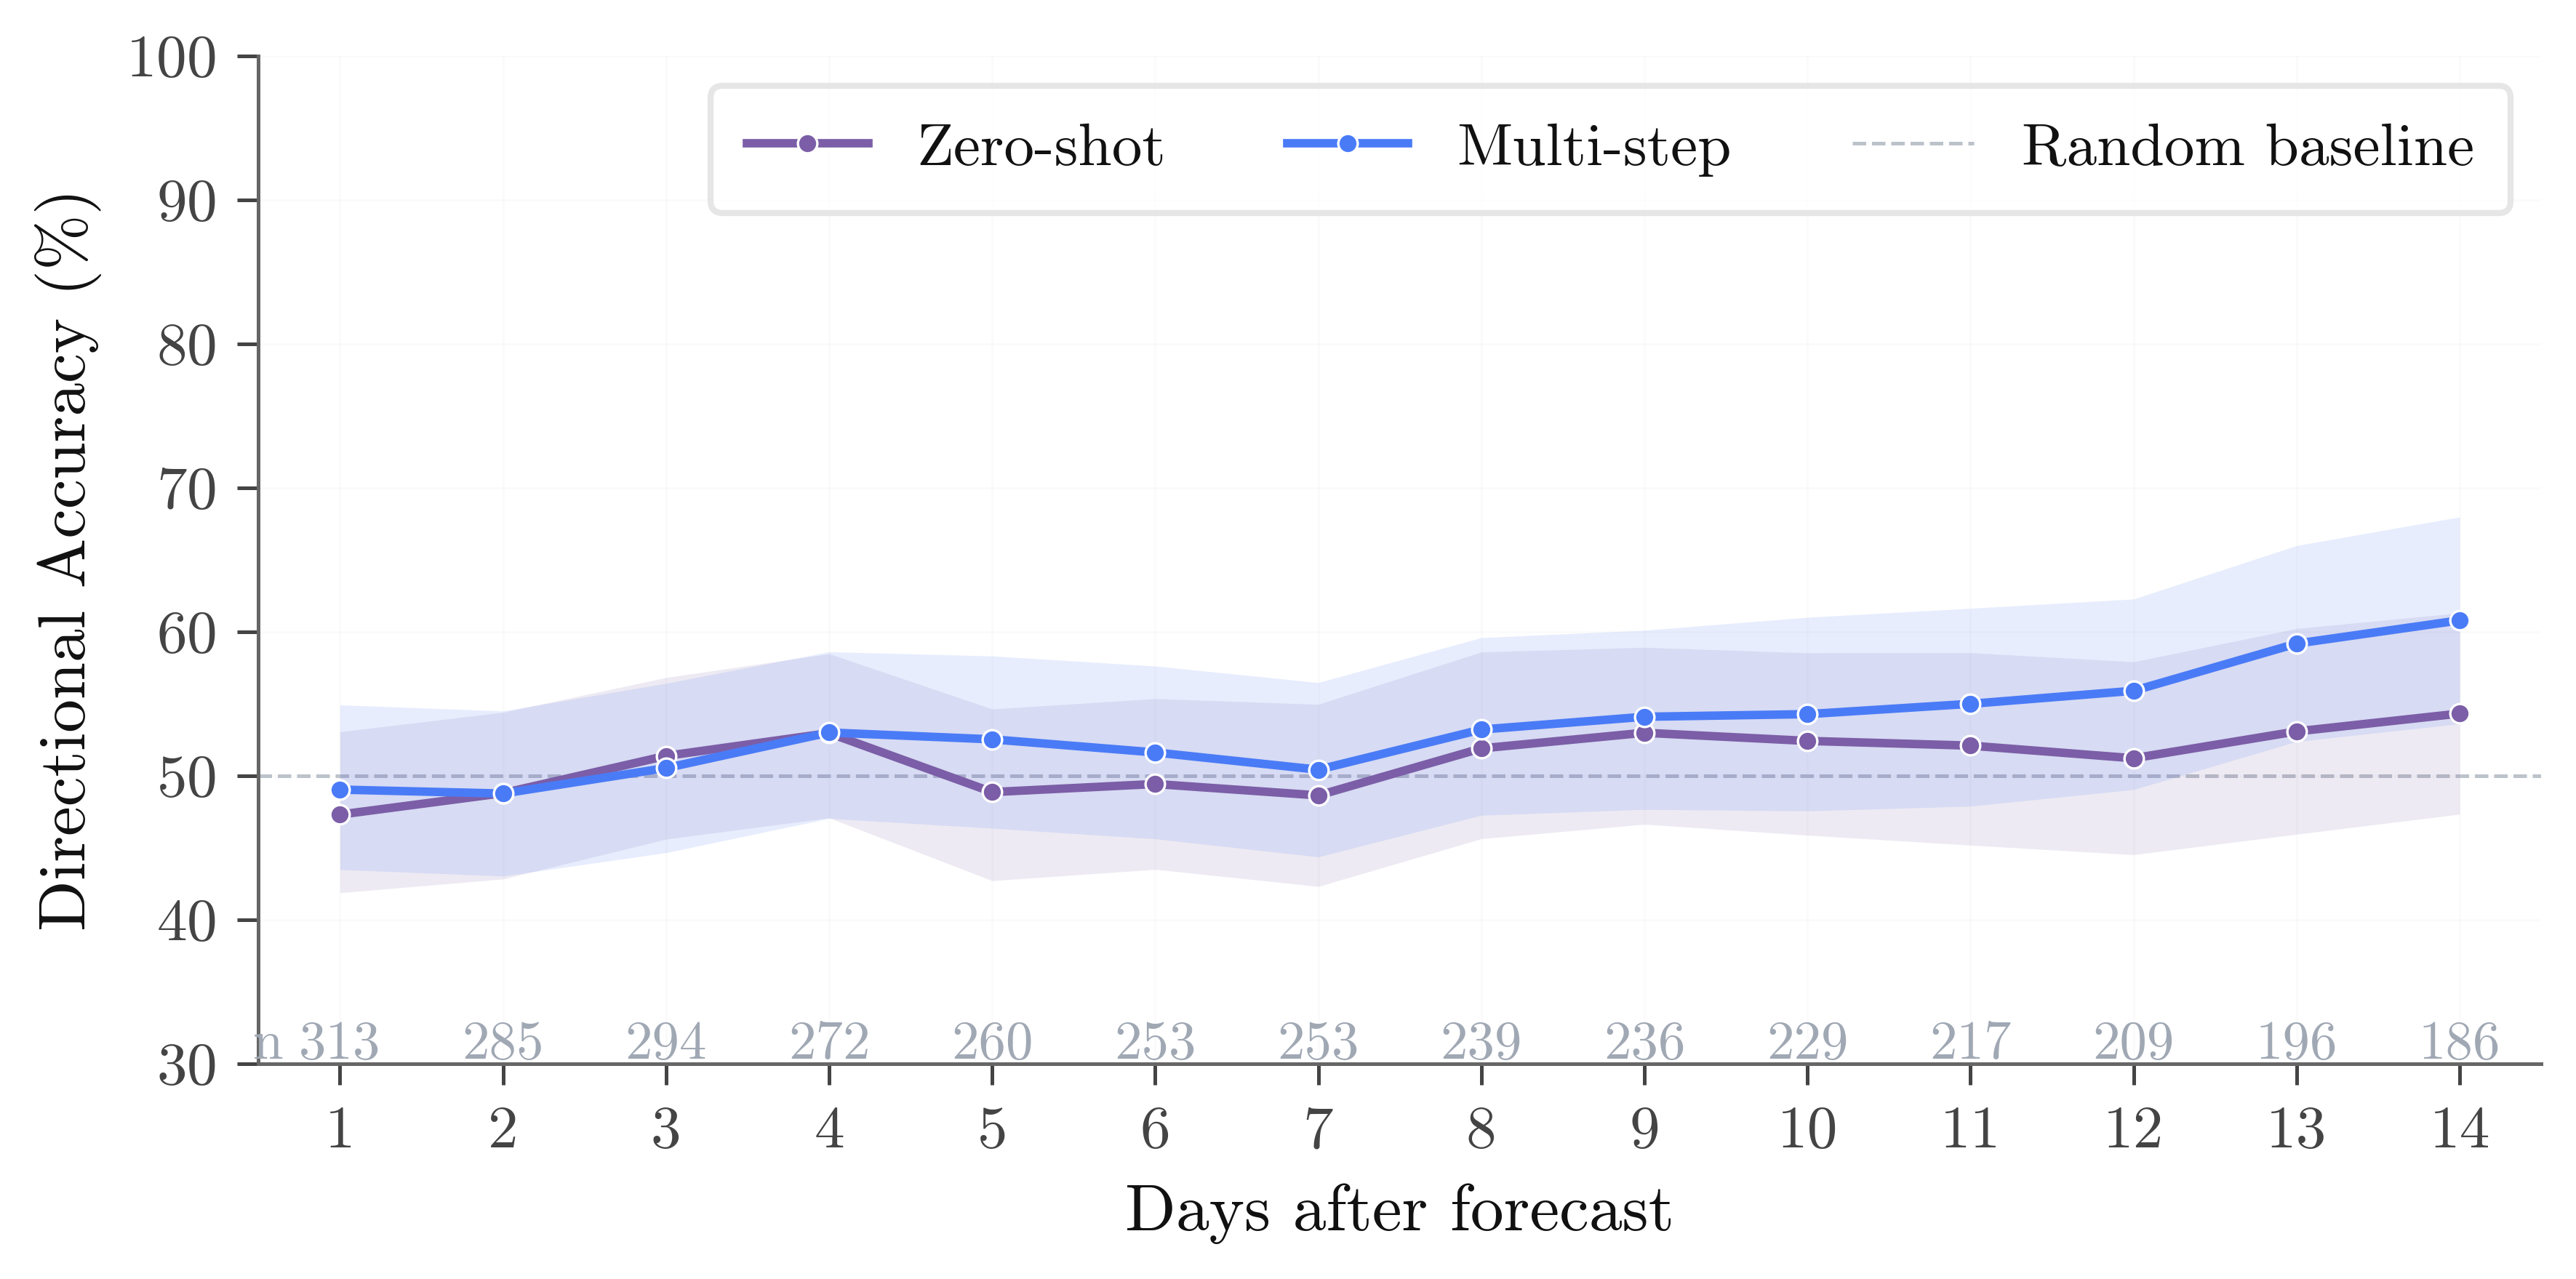
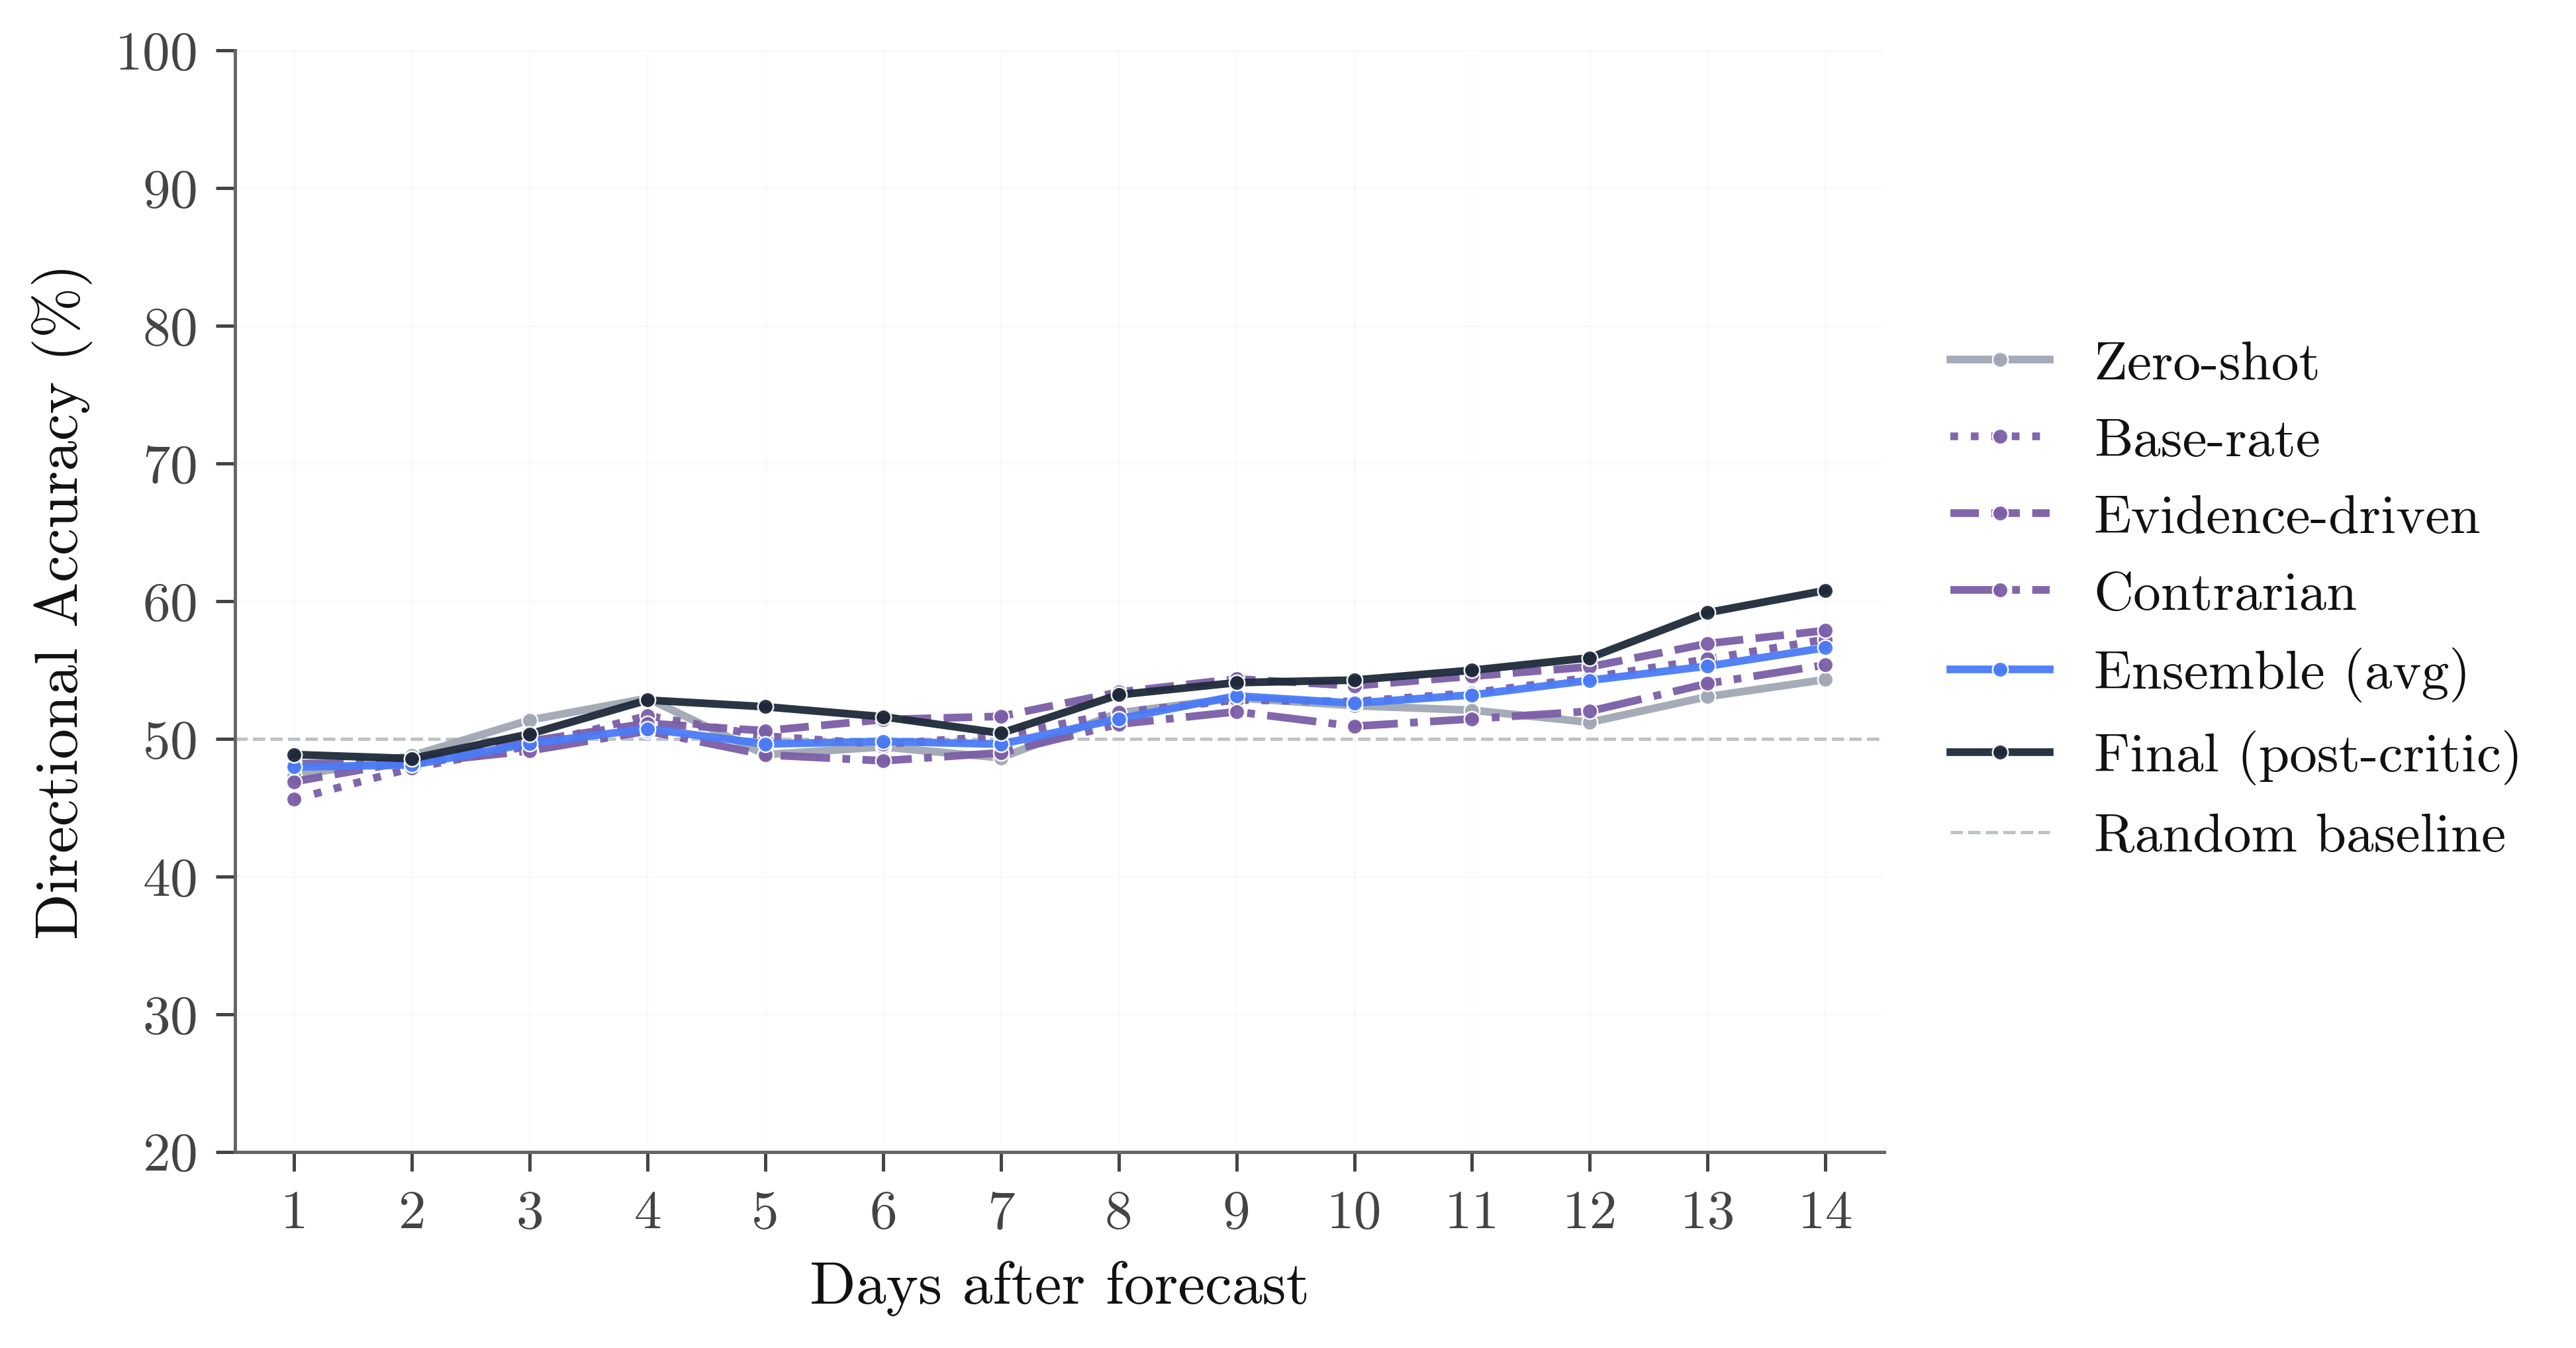
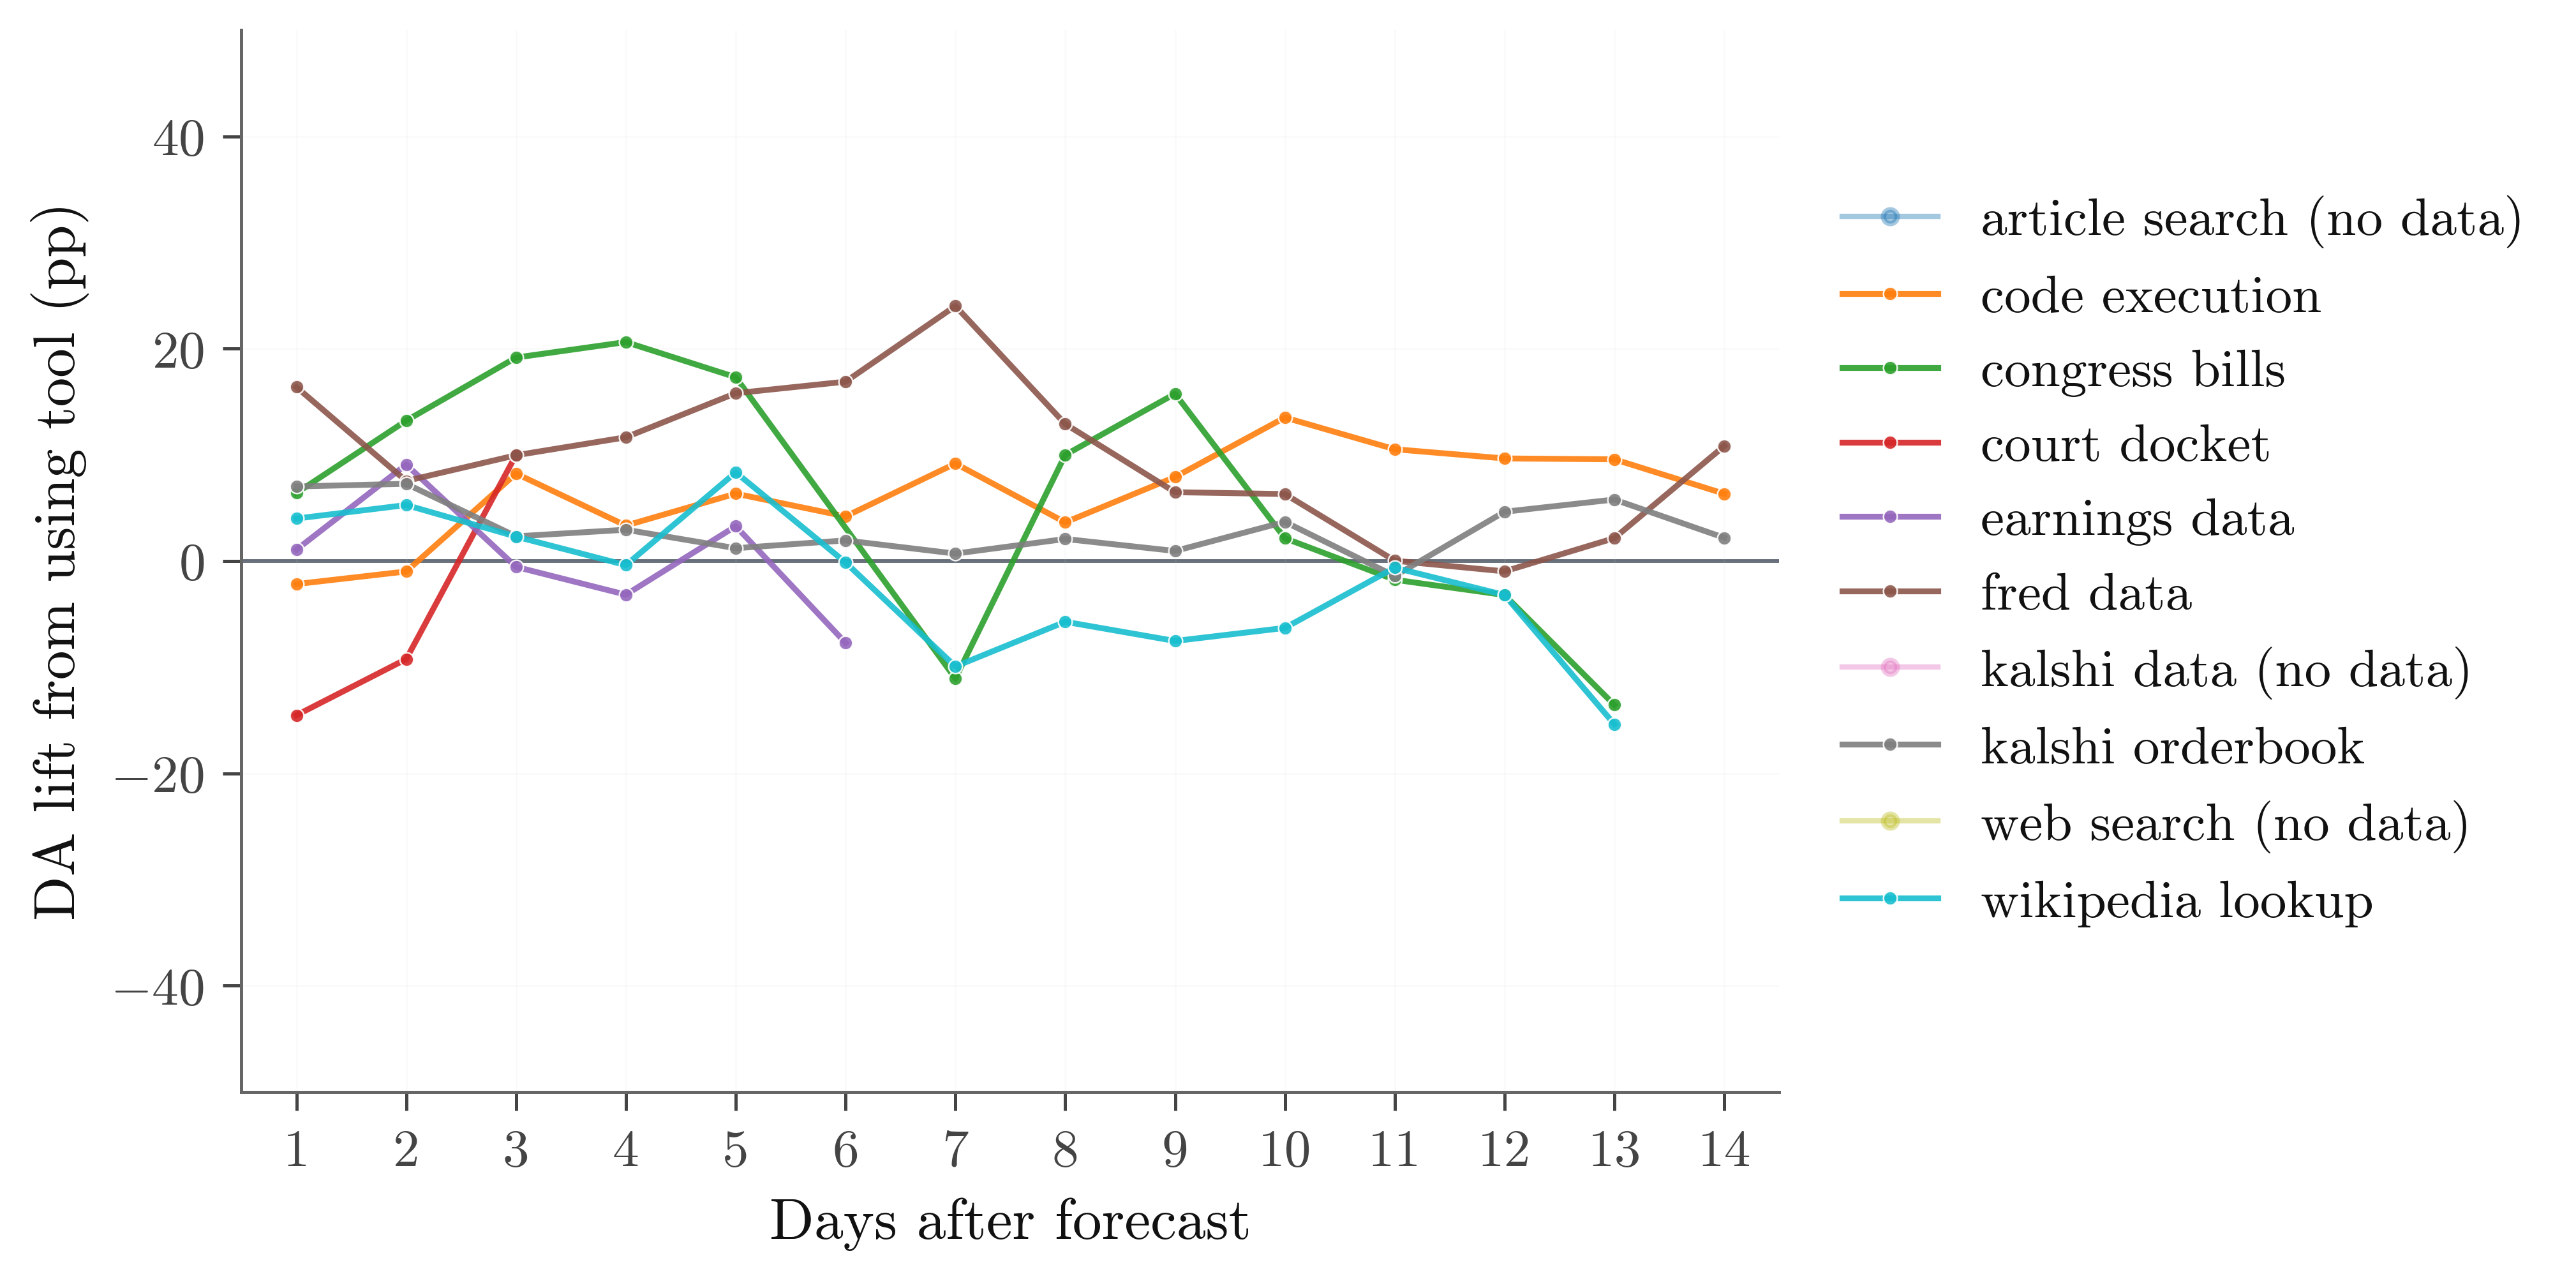
Directional accuracy (DA) asks the simpler binary question: did the market move in the direction we predicted? The IC findings hold qualitatively under DA, but with markedly smaller effect sizes, consistent with DA discarding the magnitude information IC retains. We keep DA charts here for comparison with prior prediction-market work; IC is the primary headline.
Charts were last regenerated from the figures_apr7plus cohort (259 V2 scans,
archived excluded). The analysis scripts and chart templates are in analysis/
on GitHub;
rerun them against a fresh /api/export pull to reproduce.